Max Loss: $20 Max Win: $2929
Risk
Historical Performance (44 Trades)
Trade Payout in 1 Days
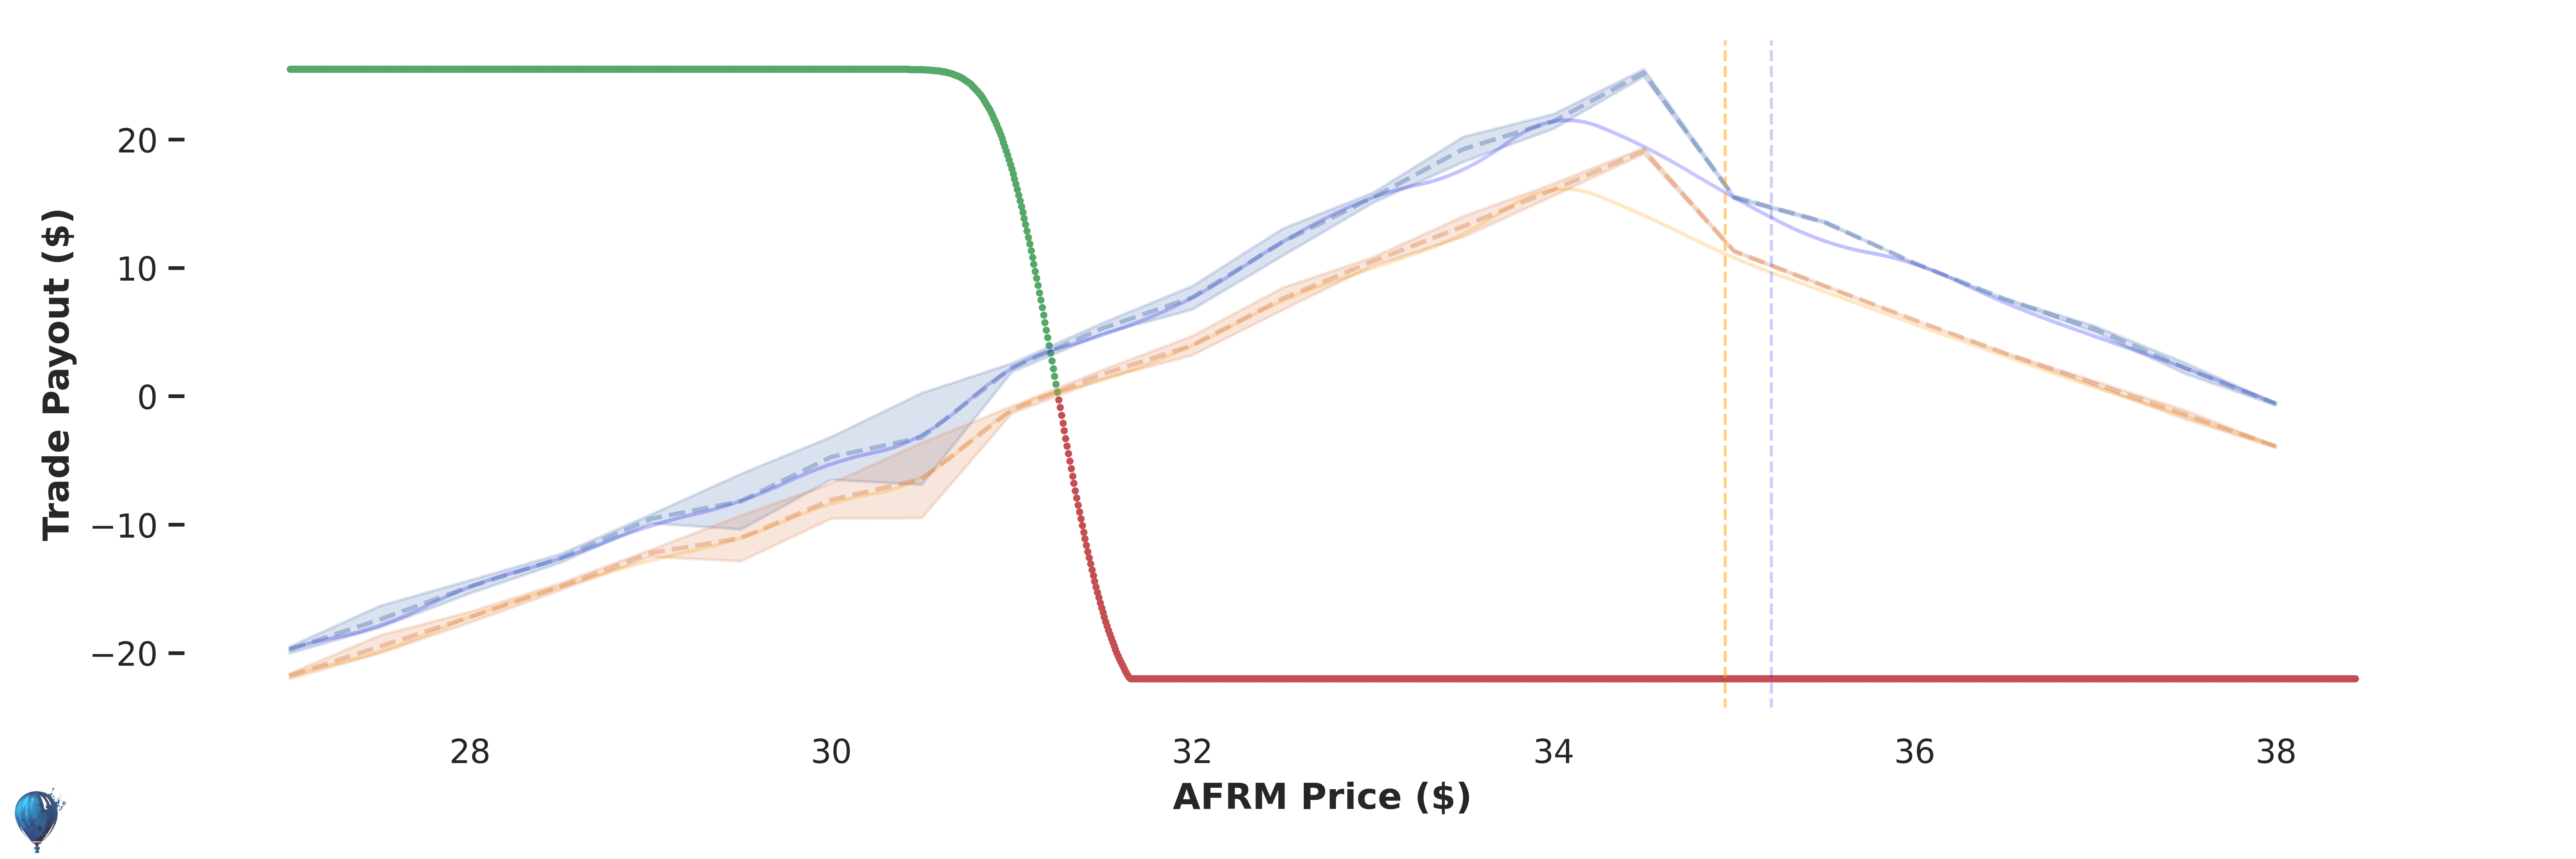
Green line
Red line Blue line
Orange line
Access Full AFRM Strategy + 1-Click Execution
Max Loss: $6 Max Win: $43
Risk
Historical Performance (44 Trades)
Trade Payout in 8 Days
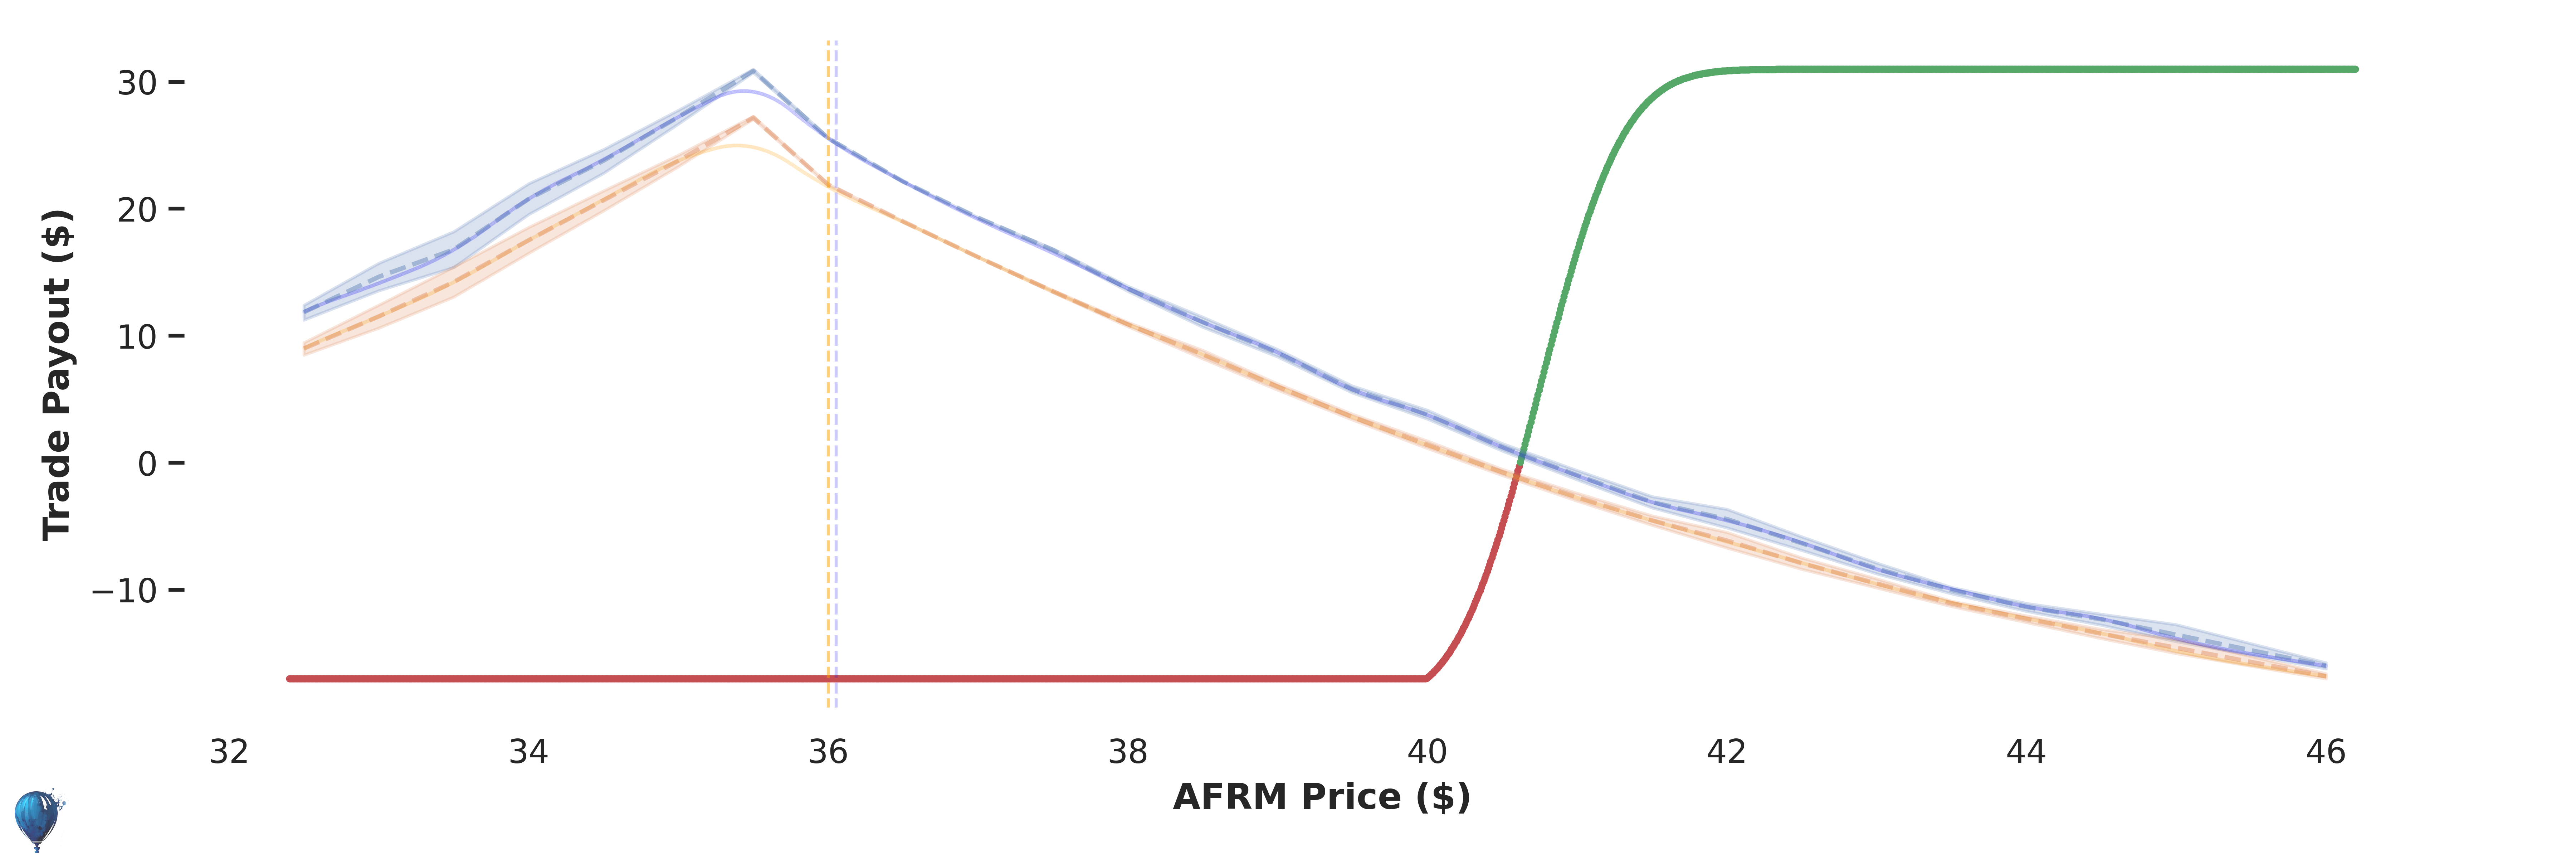
Green line
Red line Blue line
Orange line
Access Full AFRM Strategy + 1-Click Execution