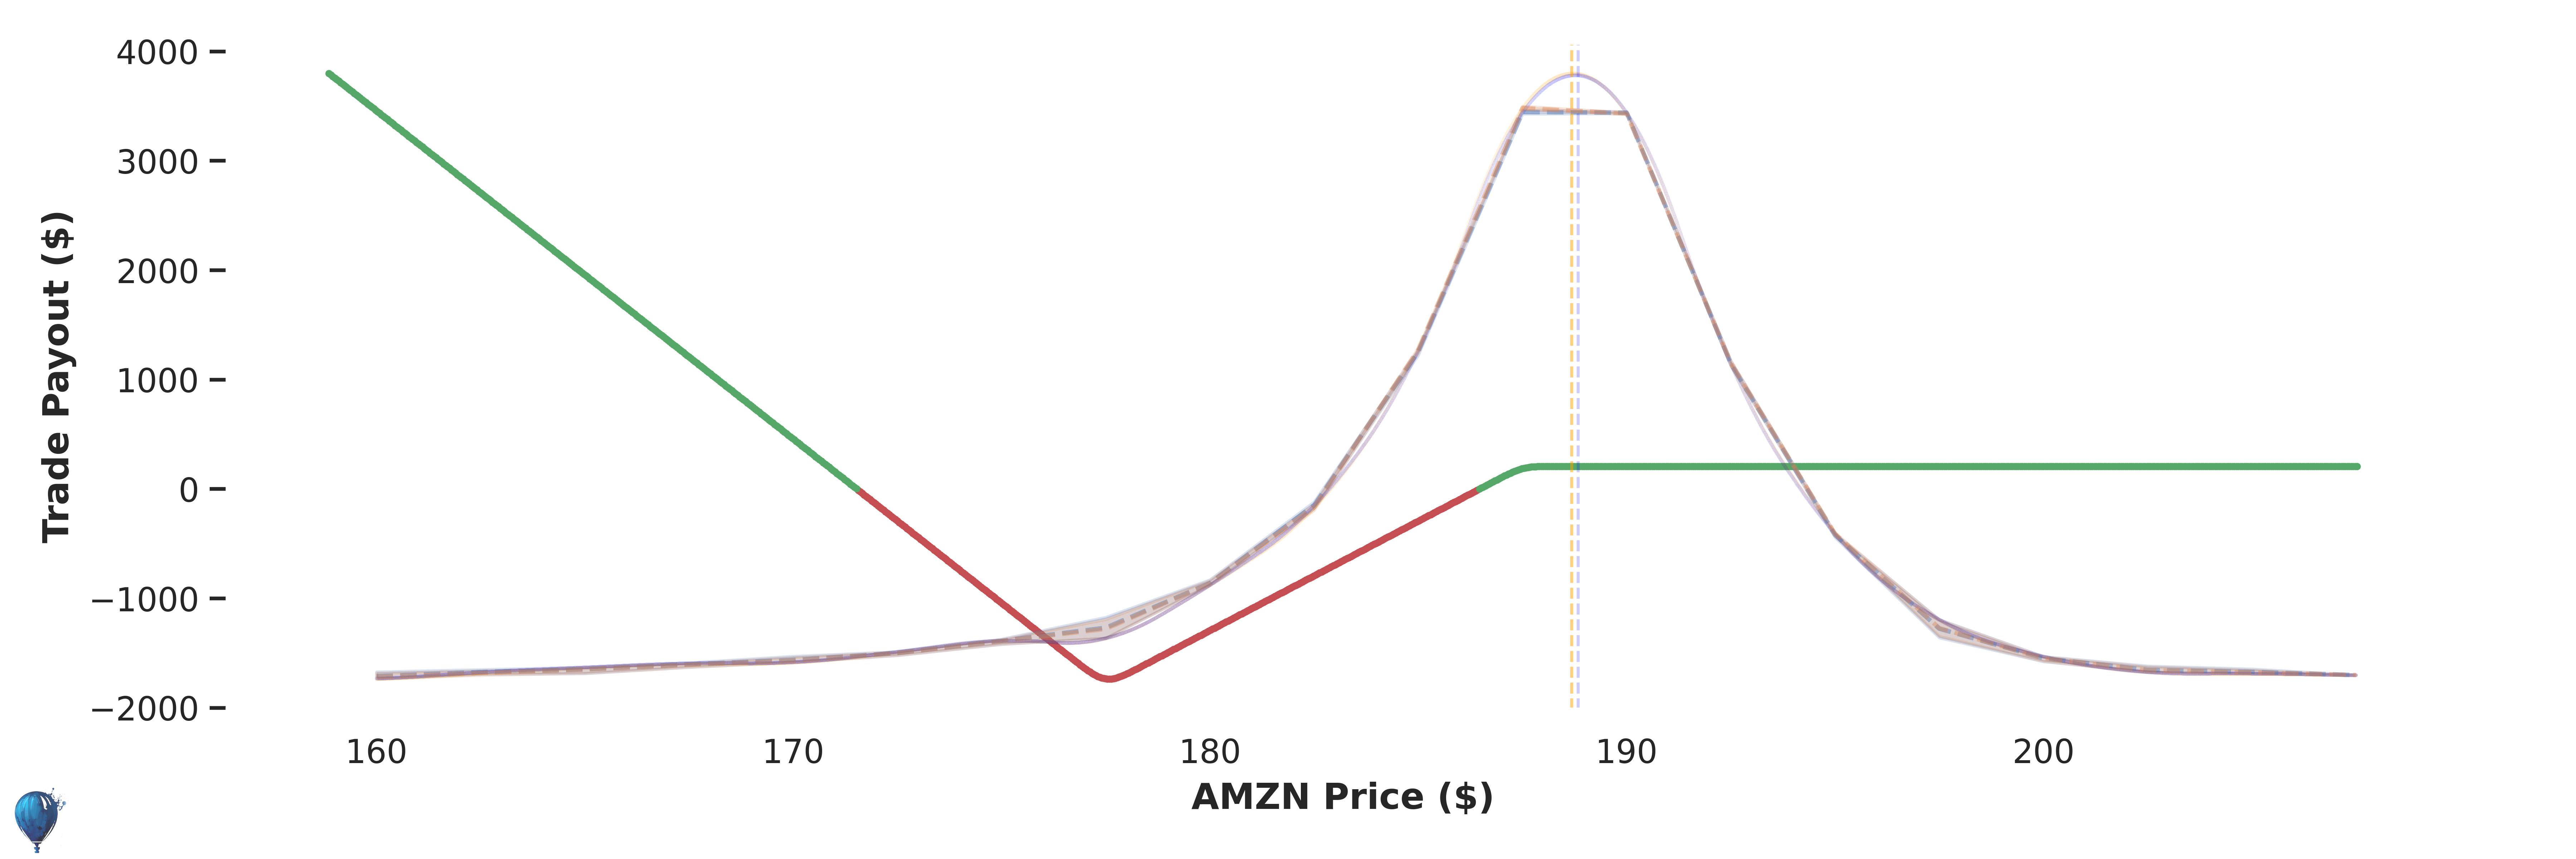
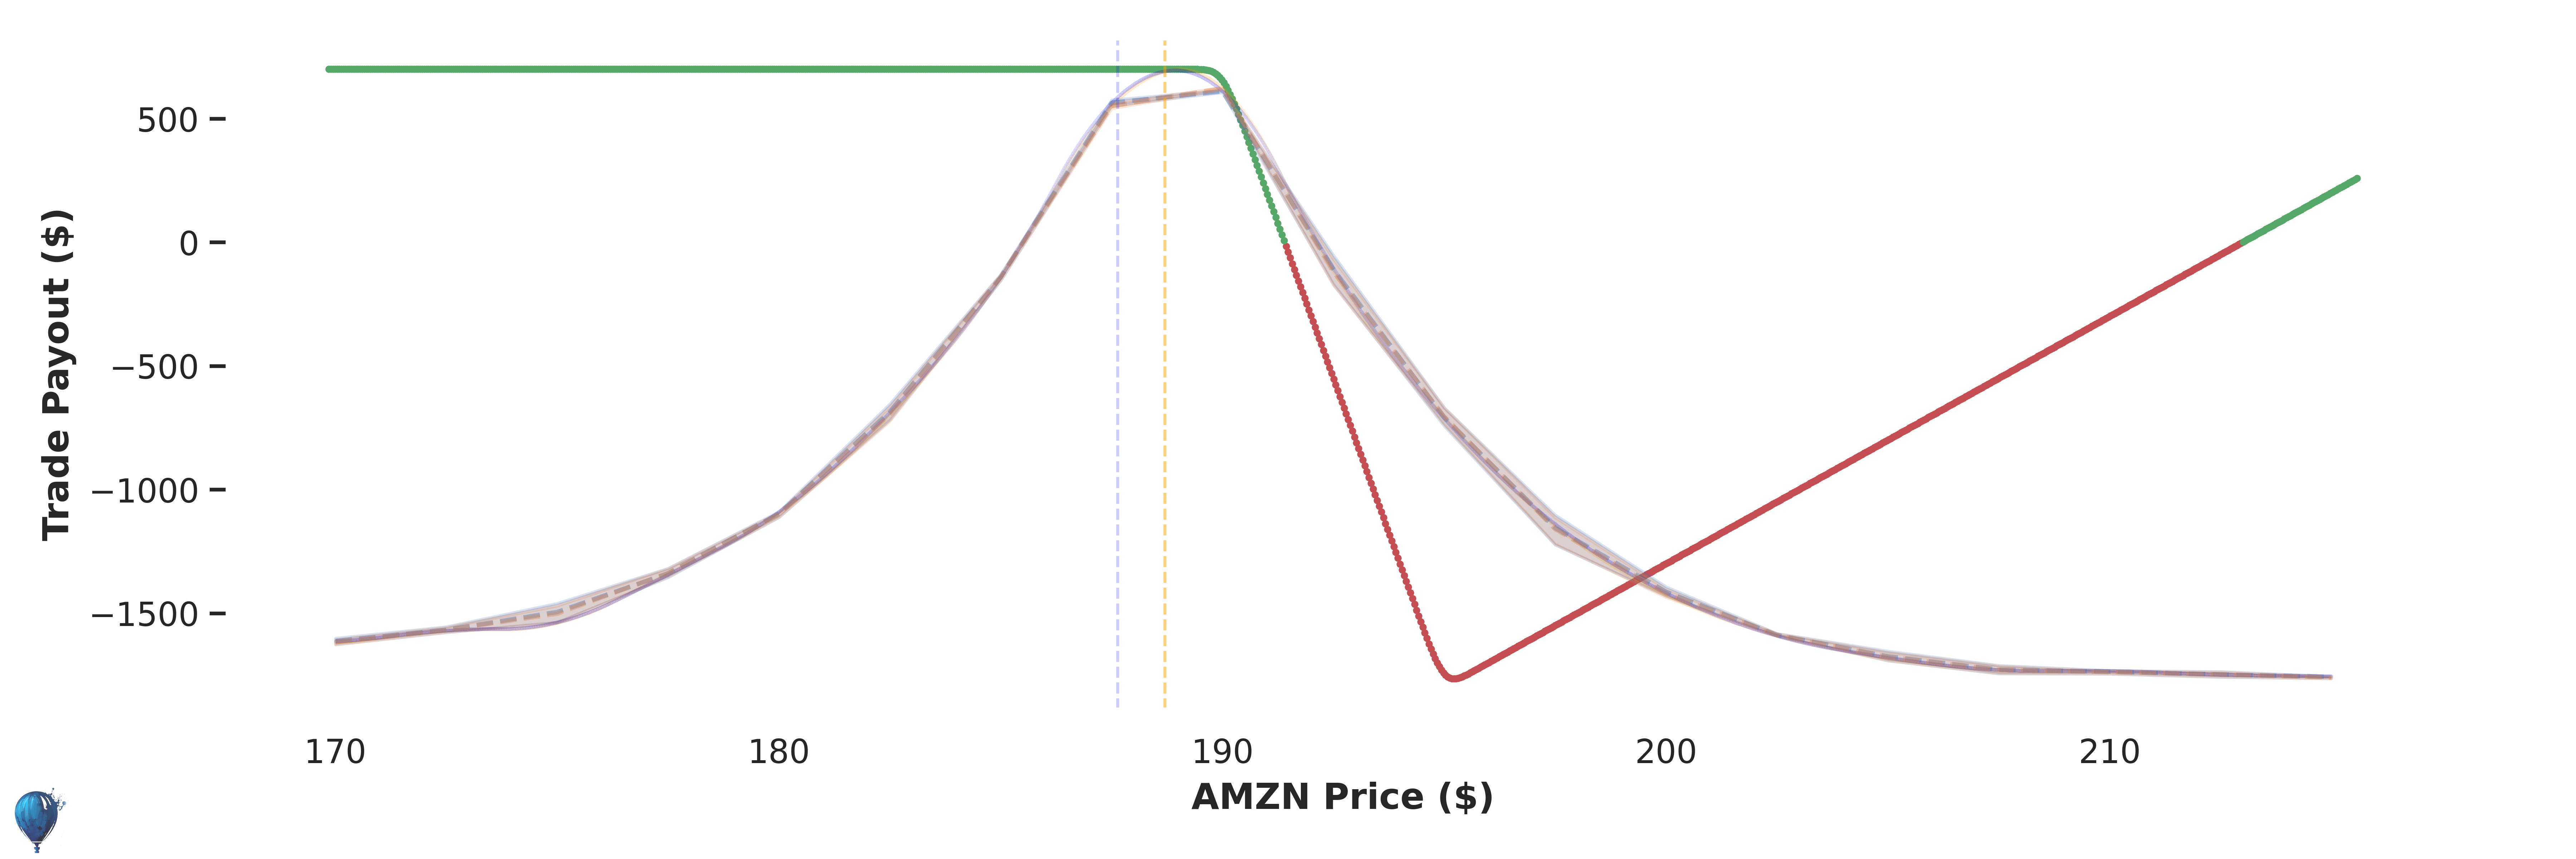
📉 Bearish
📈 Bullish
Credit:
$138
Max Loss:
$1112
Annual Return:
229%
Odds of Profit
(?)
52%
Trade Edge
(?)
+ $17
Historical Performance: Trades
% Annual
Daily Optimized
Bullish
Trade Payout in 1 Days
Potential Profit
Potential Loss
Price Distribution
Show Trade Details
Sell 1
AMZN 07/26/2024 180.00 P
@ $1.53
Market Probability In The Money: 52%
Buy 4
AMZN 07/26/2024 167.50 P
@ $0.04
Market Probability In The Money: 2%
⚖️ Trade Balancer
Trade Balancer
Underlying Correlation: 0.96
Video Tutorial
Cheap Hedge
Underlying Correlation: -0.96
Video Tutorial
Options Pricing
Historical Performance
Risk Profiles
Current Options Pricing
X Axis:
Price of AMZN
Dashed blue line:
Helium estimated price
Dashed orange line:
Market last price
Vertical orange line:
AMZN last closing price
Historical Performance
Total Return:
% (% Annual)
Average P/L:
$
# Trades:
Success:
%
X Axis:
Time
Y Axis:
Cumulative % return
Vertical lines:
Days with new trades added
Download Trade Log
Sensitivity to Volatility
X Axis:
% price change of implied volatility (uncertainty)
Y Axis:
potential
profit
or
loss
due to current changes in implied volatility
Trade Carry
X Axis:
days projected into the future
Y Axis:
potential
profit
or
loss
due to time
Greeks
Delta
(?)
:
$43.2
Beta
(?)
:
$43.2
Theta
(?)
:
$13.4
Gamma
(?)
:
$-7.8
Vega
(?)
:
$-2.0
Optimized
July 25, 2024
.
Share Link:
?
Credit:
$138
Max Loss:
$861
Annual Return:
305%
Odds of Profit
(?)
56%
Trade Edge
(?)
$-56
Historical Performance: Trades
% Annual
Daily Optimized
Bearish
Trade Payout in 1 Days
Potential Profit
Potential Loss
Price Distribution
Show Trade Details
Sell 1
AMZN 07/26/2024 180.00 C
@ $1.5
Market Probability In The Money: 48%
Buy 3
AMZN 07/26/2024 190.00 C
@ $0.04
Market Probability In The Money: 2%
⚖️ Trade Balancer
Trade Balancer
Underlying Correlation: 0.96
Video Tutorial
Cheap Hedge
Underlying Correlation: -0.96
Video Tutorial
Options Pricing
Historical Performance
Risk Profiles
Current Options Pricing
X Axis:
Price of AMZN
Dashed blue line:
Helium estimated price
Dashed orange line:
Market last price
Vertical orange line:
AMZN last closing price
Historical Performance
Total Return:
% (% Annual)
Average P/L:
$
# Trades:
Success:
%
X Axis:
Time
Y Axis:
Cumulative % return
Vertical lines:
Days with new trades added
Download Trade Log
Sensitivity to Volatility
X Axis:
% price change of implied volatility (uncertainty)
Y Axis:
potential
profit
or
loss
due to current changes in implied volatility
Trade Carry
X Axis:
days projected into the future
Y Axis:
potential
profit
or
loss
due to time
Greeks
Delta
(?)
:
$-43.1
Beta
(?)
:
$-43.1
Theta
(?)
:
$42.9
Gamma
(?)
:
$-7.2
Vega
(?)
:
$-2.4
Optimized
July 25, 2024
.
Share Link:
?