📉 Bearish
📈 Bullish
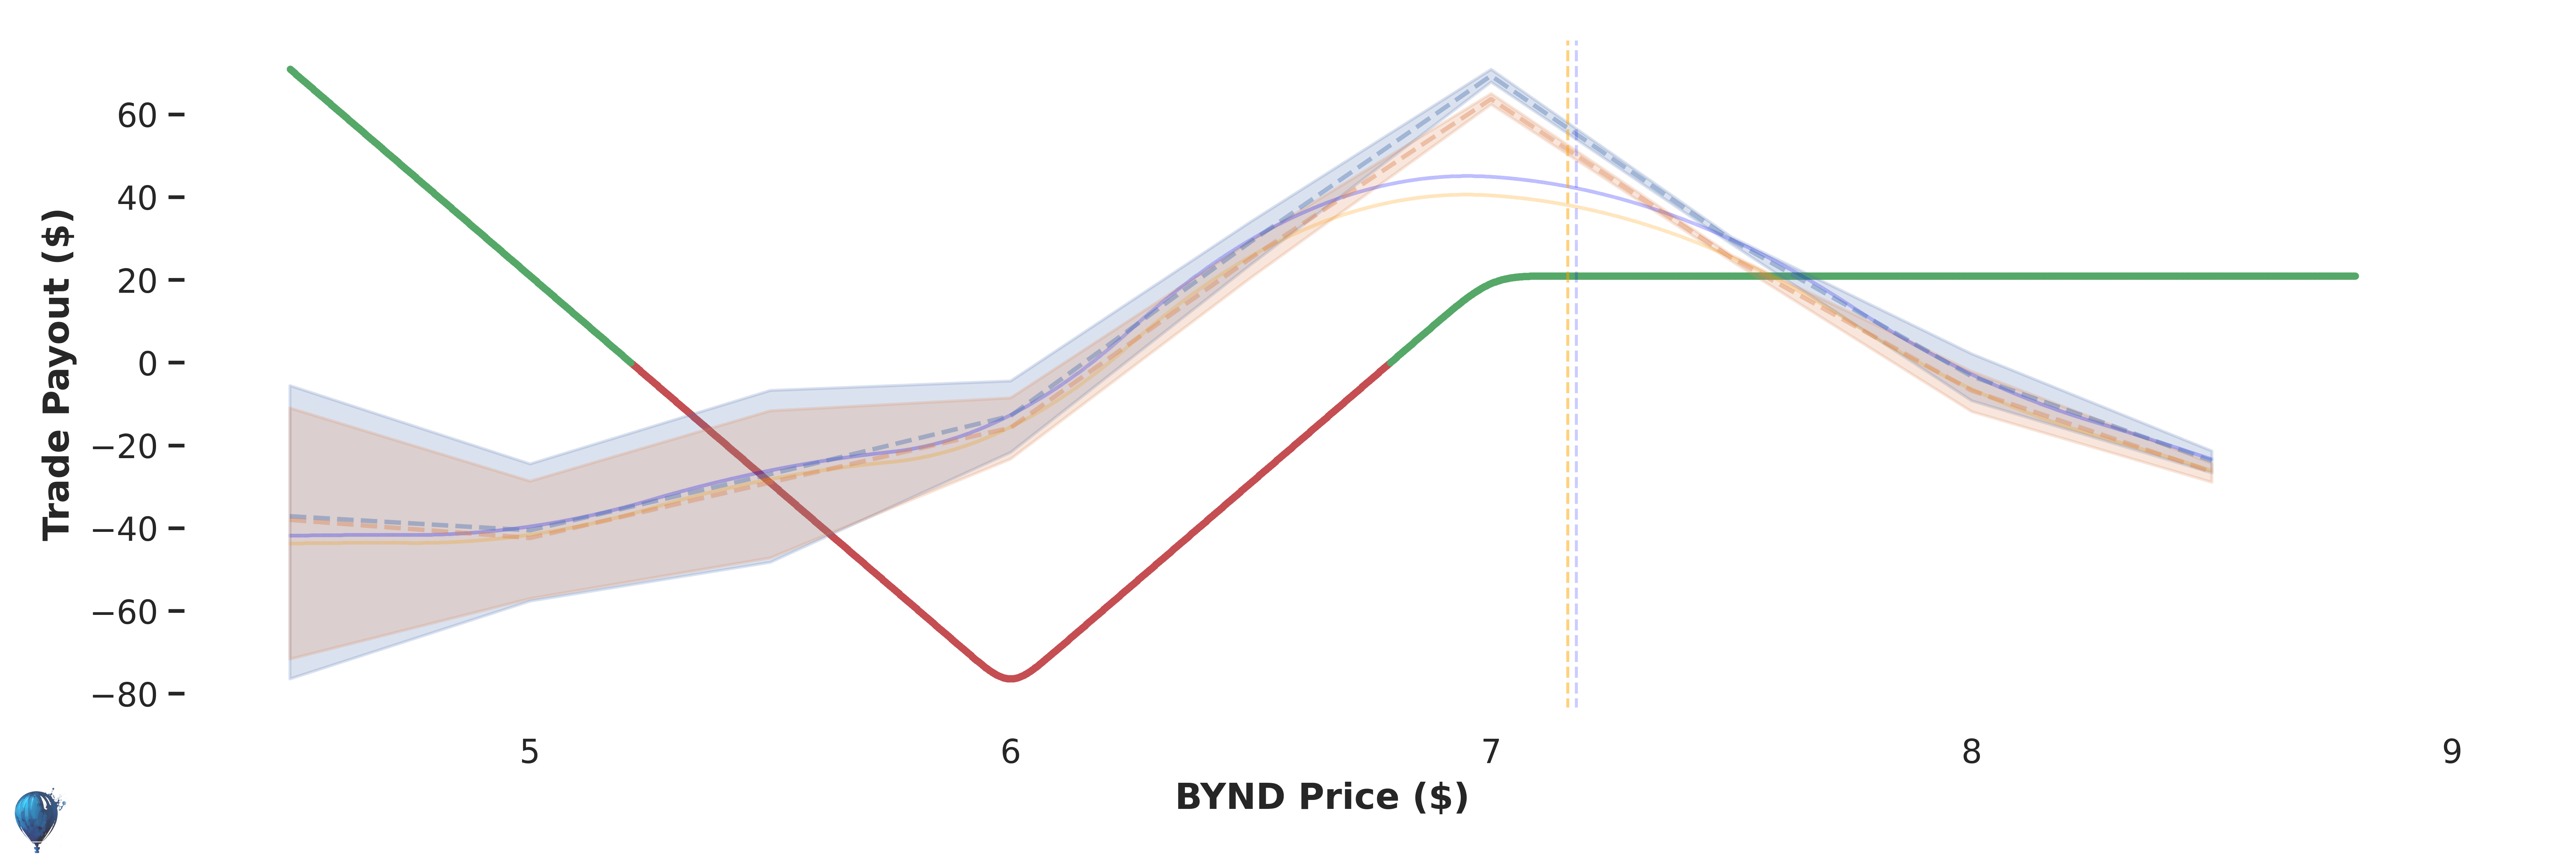
Credit:
$23
Max Loss:
$76
Annual Return:
231%
Odds of Profit
(?)
70%
Trade Edge
(?)
$-61
Historical Performance: 12 Trades
-43% Annual
Trade Payout in 7 Days
Green line
Red line
Blue line
Orange line
Access Full BYND Strategy + 1-Click Execution
Unlock Full Strategy
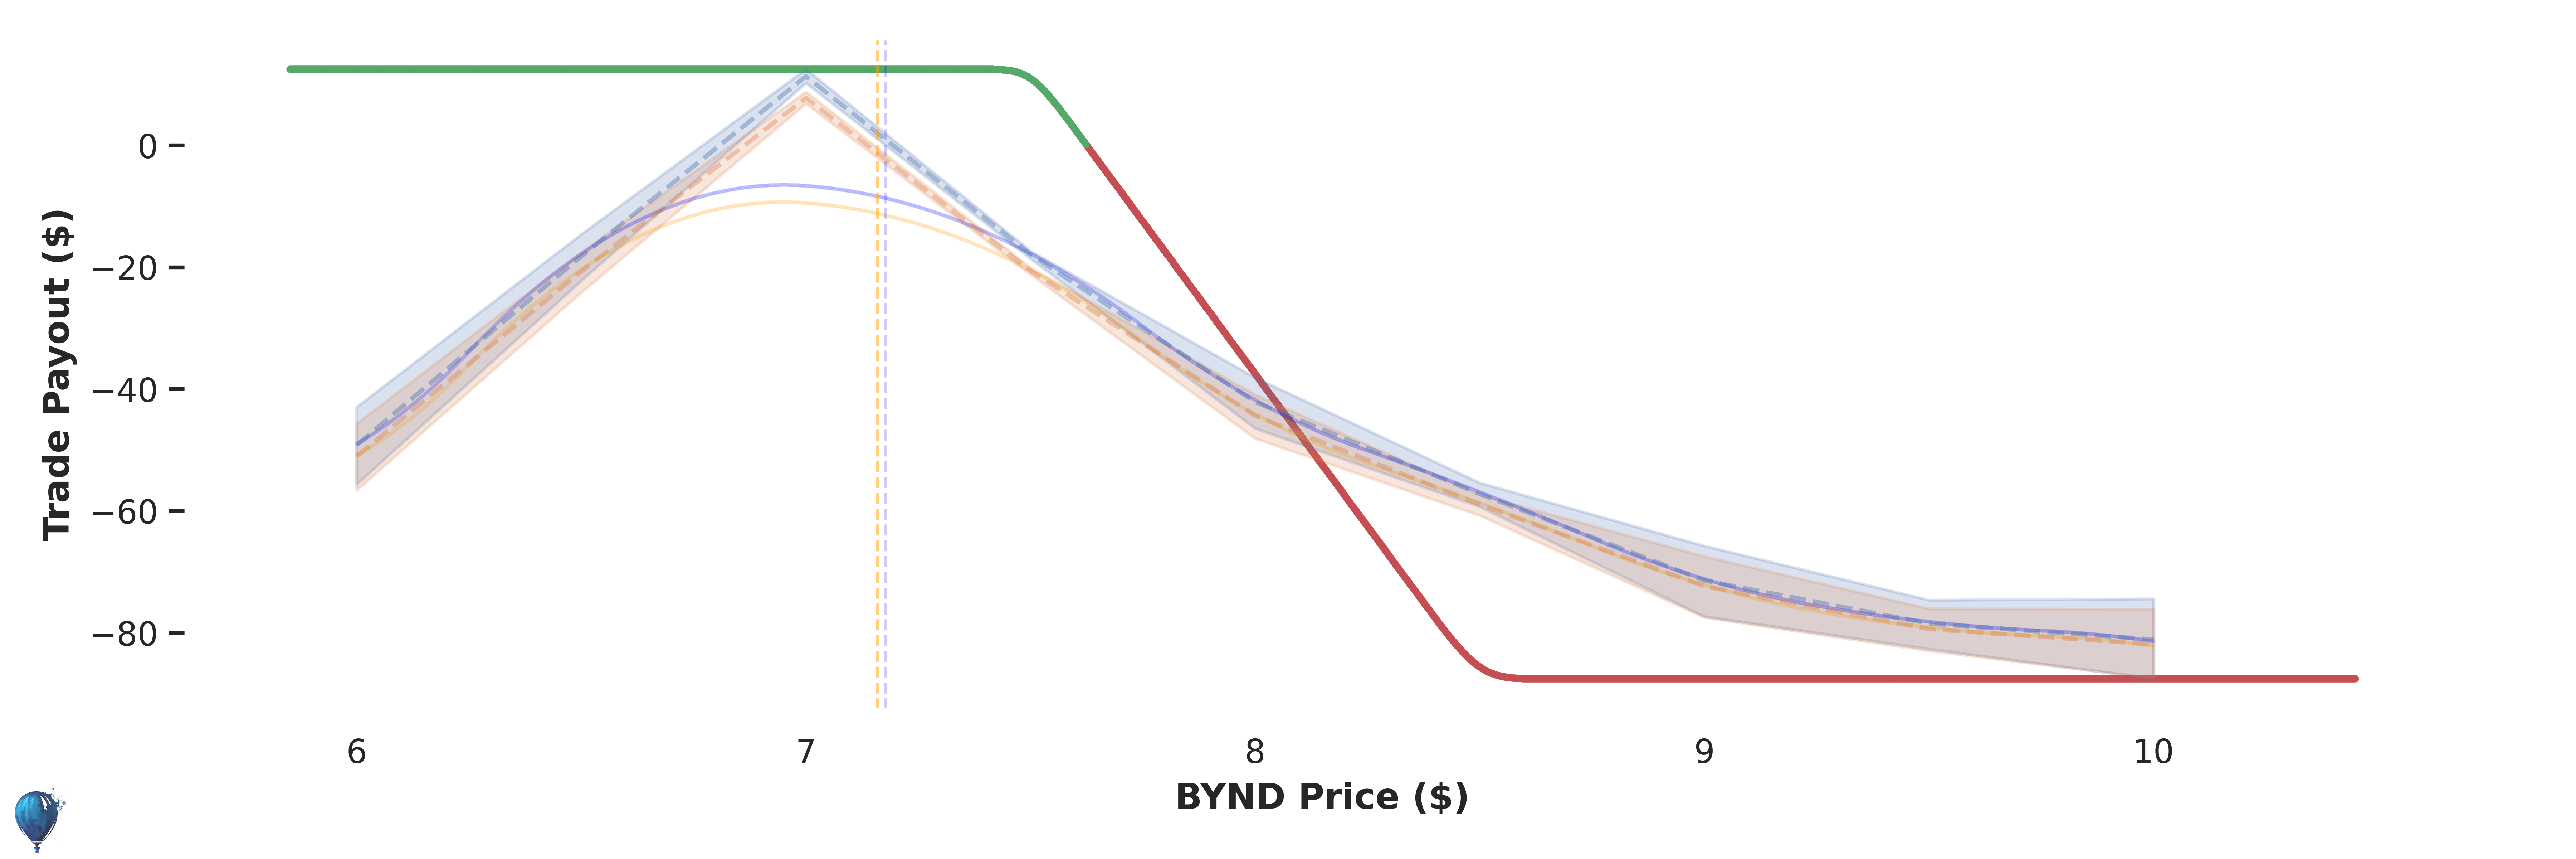
Credit:
$15
Max Loss:
$85
Annual Return:
91%
Odds of Profit
(?)
80%
Trade Edge
(?)
+ $16
Historical Performance: 13 Trades
+ 11% Annual
Trade Payout in 14 Days
Green line
Red line
Blue line
Orange line
Access Full BYND Strategy + 1-Click Execution
Unlock Full Strategy