📈 Bullish
📉 Bearish
Max Loss:
$16
Max Win:
$34
Risk
1
to make 2.3
Odds of Profit
(?)
46%
Trade Edge
(?)
$-18
Historical Performance (88 Trades)
-46% Annual
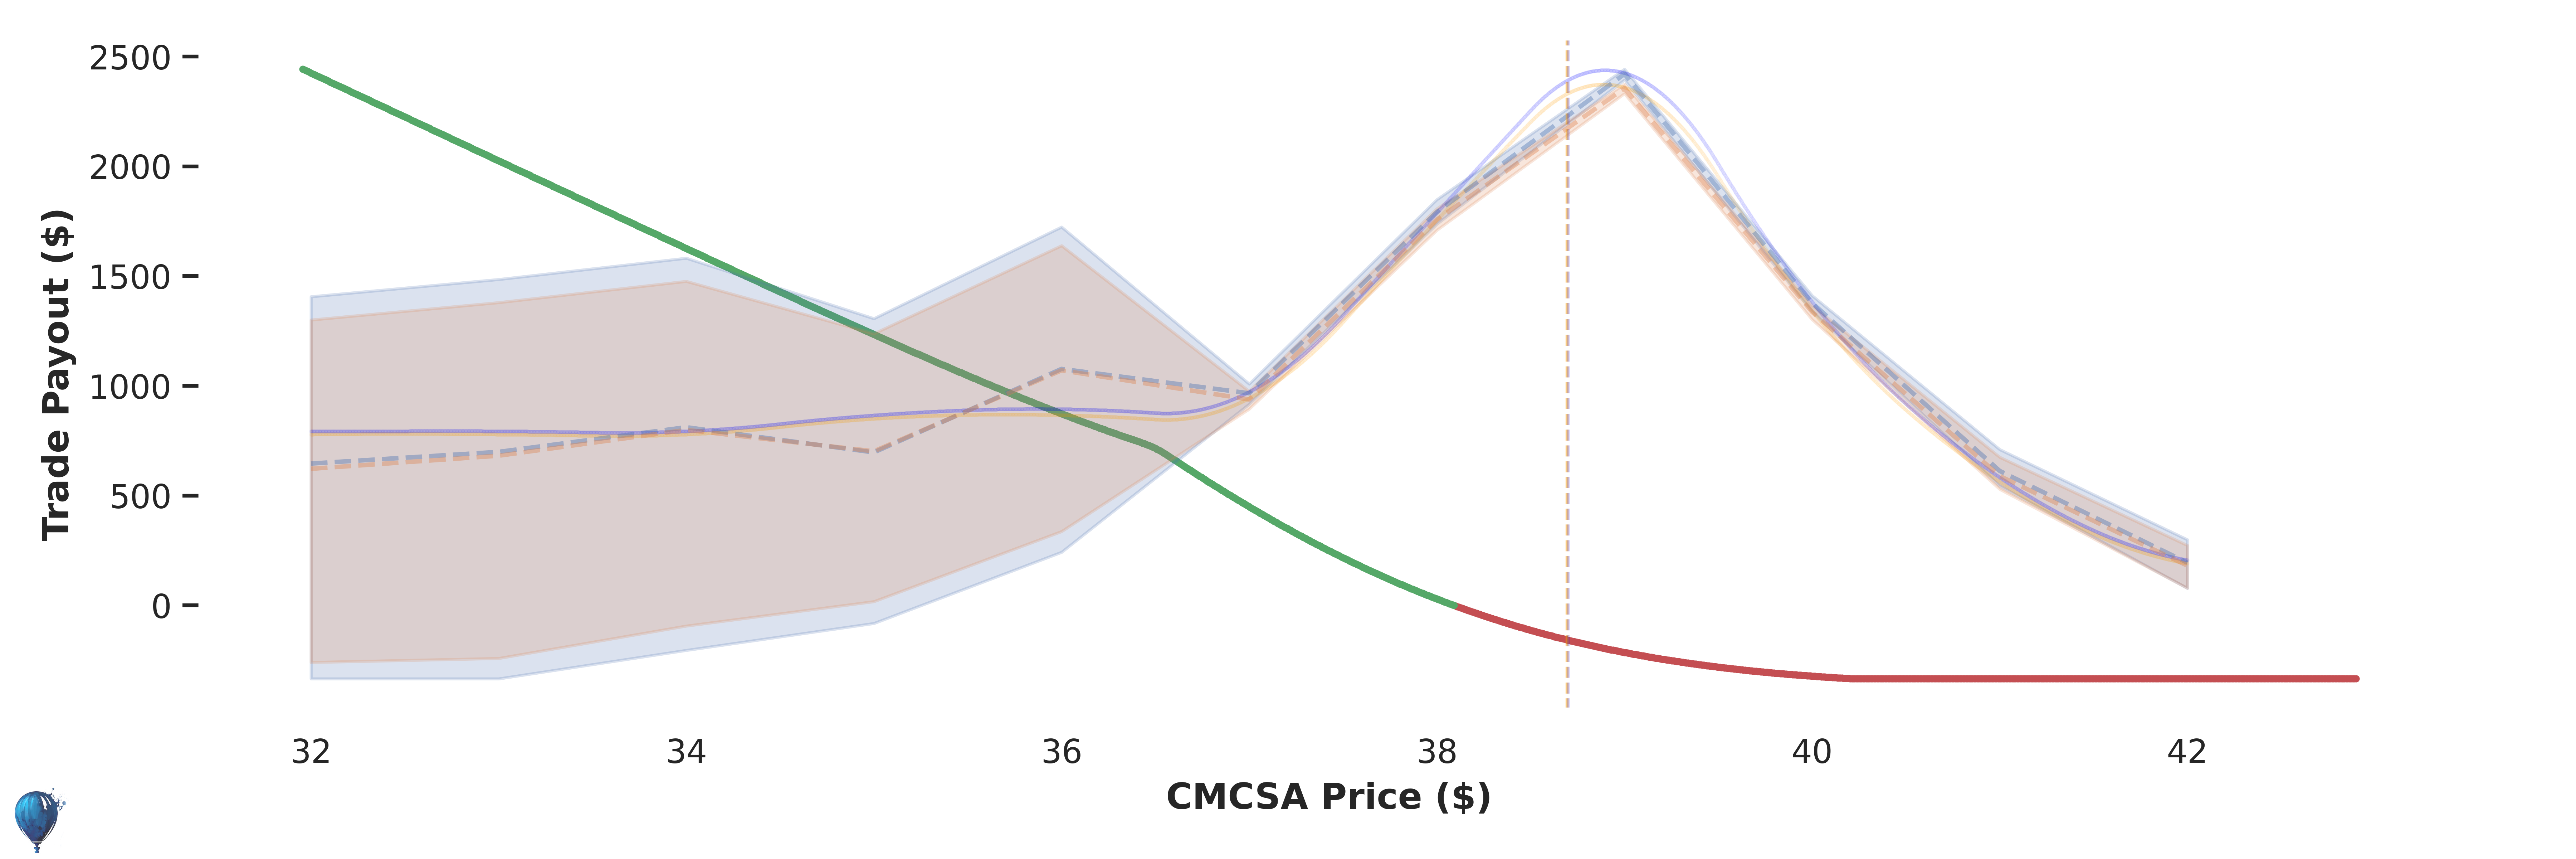
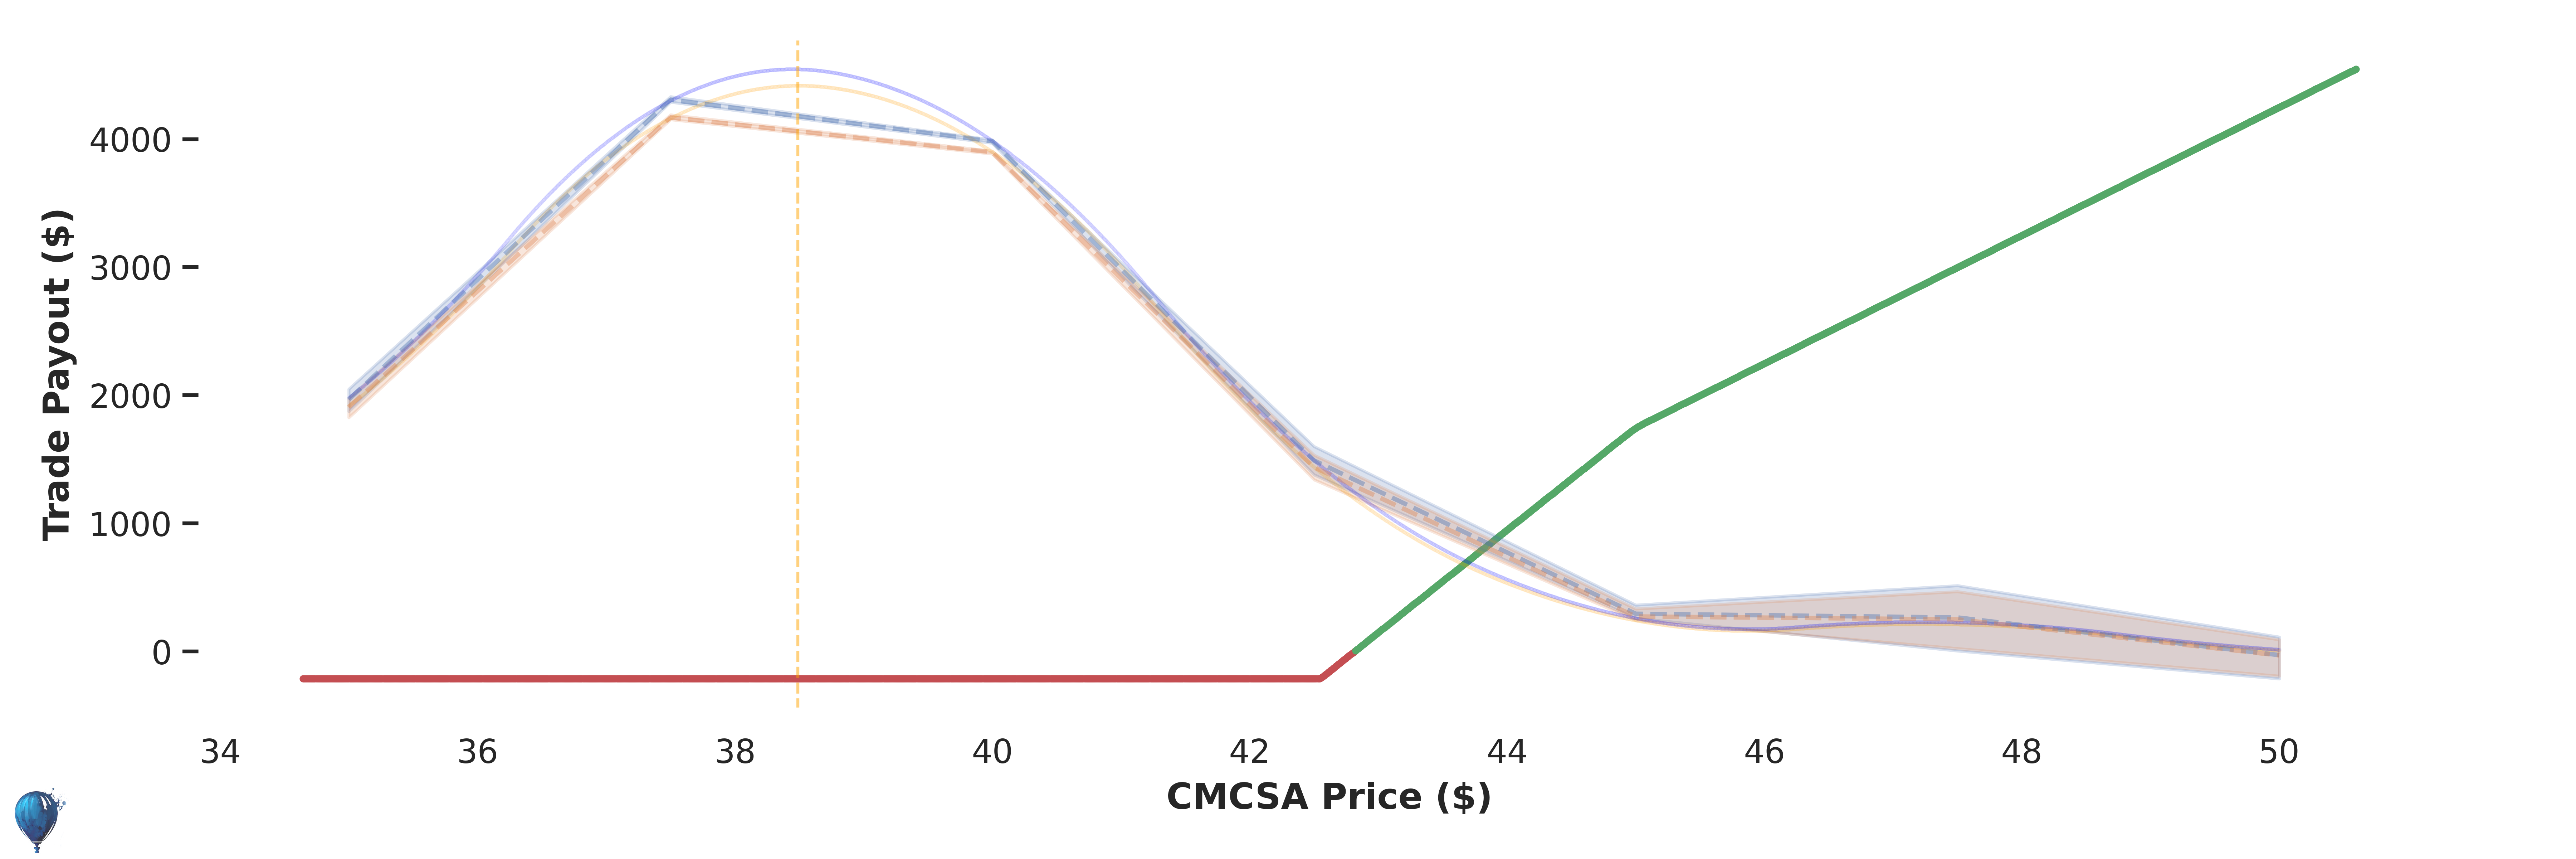
Daily Optimized
Bearish
Trade Payout in 9 Days
Potential Profit
Potential Loss
Price Distribution
Show Trade Details
Buy 1
CMCSA 10/25/2024 42.00 P
@ $0.39
Market Probability In The Money: 42%
Sell 1
CMCSA 10/25/2024 41.50 P
@ $0.24
Market Probability In The Money: 29%
⚖️ Trade Balancer
Trade Balancer
Underlying Correlation: 0.73
Video Tutorial
Cheap Hedge
Underlying Correlation: -0.66
Video Tutorial
Options Pricing
Historical Performance
Risk Profiles
Current Options Pricing
X Axis:
Price of CMCSA
Dashed blue line:
Helium estimated price
Dashed orange line:
Market last price
Vertical orange line:
CMCSA last closing price
Historical Performance
Total Return:
-41% (-46% Annual)
Average P/L:
$-85.94
# Trades:
88
Success:
17%
X Axis:
Time
Y Axis:
Cumulative % return
Vertical lines:
Days with new trades added
Download Trade Log
Sensitivity to Volatility
X Axis:
% price change of implied volatility (uncertainty)
Y Axis:
potential
profit
or
loss
due to current changes in implied volatility
Trade Time Decay
X Axis:
days projected into the future
Y Axis:
potential
profit
or
loss
due to time
Greeks
Delta
(?)
:
$-12.9
Beta
(?)
:
$8.1
Theta
(?)
:
$-0.2
Gamma
(?)
:
$5.2
Vega
(?)
:
$0.4
Optimized
October 16, 2024
.
Share Link:
?
Max Loss:
$31
Max Win:
$218
Risk
1
to make 7.1
Odds of Profit
(?)
14%
Trade Edge
(?)
$-32
Historical Performance (87 Trades)
-45% Annual
Daily Optimized
Bullish
Trade Payout in 93 Days
Potential Profit
Potential Loss
Price Distribution
Show Trade Details
Buy 1
CMCSA 01/17/2025 47.50 C
@ $0.59
Market Probability In The Money: 18%
Sell 1
CMCSA 01/17/2025 50.00 C
@ $0.29
Market Probability In The Money: 10%
⚖️ Trade Balancer
Trade Balancer
Underlying Correlation: -0.65
Video Tutorial
Cheap Hedge
Underlying Correlation: -0.69
Video Tutorial
Options Pricing
Historical Performance
Risk Profiles
Current Options Pricing
X Axis:
Price of CMCSA
Dashed blue line:
Helium estimated price
Dashed orange line:
Market last price
Vertical orange line:
CMCSA last closing price
Historical Performance
Total Return:
-40% (-45% Annual)
Average P/L:
$-69.87
# Trades:
87
Success:
37%
X Axis:
Time
Y Axis:
Cumulative % return
Vertical lines:
Days with new trades added
Download Trade Log
Sensitivity to Volatility
X Axis:
% price change of implied volatility (uncertainty)
Y Axis:
potential
profit
or
loss
due to current changes in implied volatility
Trade Time Decay
X Axis:
days projected into the future
Y Axis:
potential
profit
or
loss
due to time
Greeks
Delta
(?)
:
$9.4
Beta
(?)
:
$-5.9
Theta
(?)
:
$-0.3
Gamma
(?)
:
$1.9
Vega
(?)
:
$2.0
Optimized
October 16, 2024
.
Share Link:
?