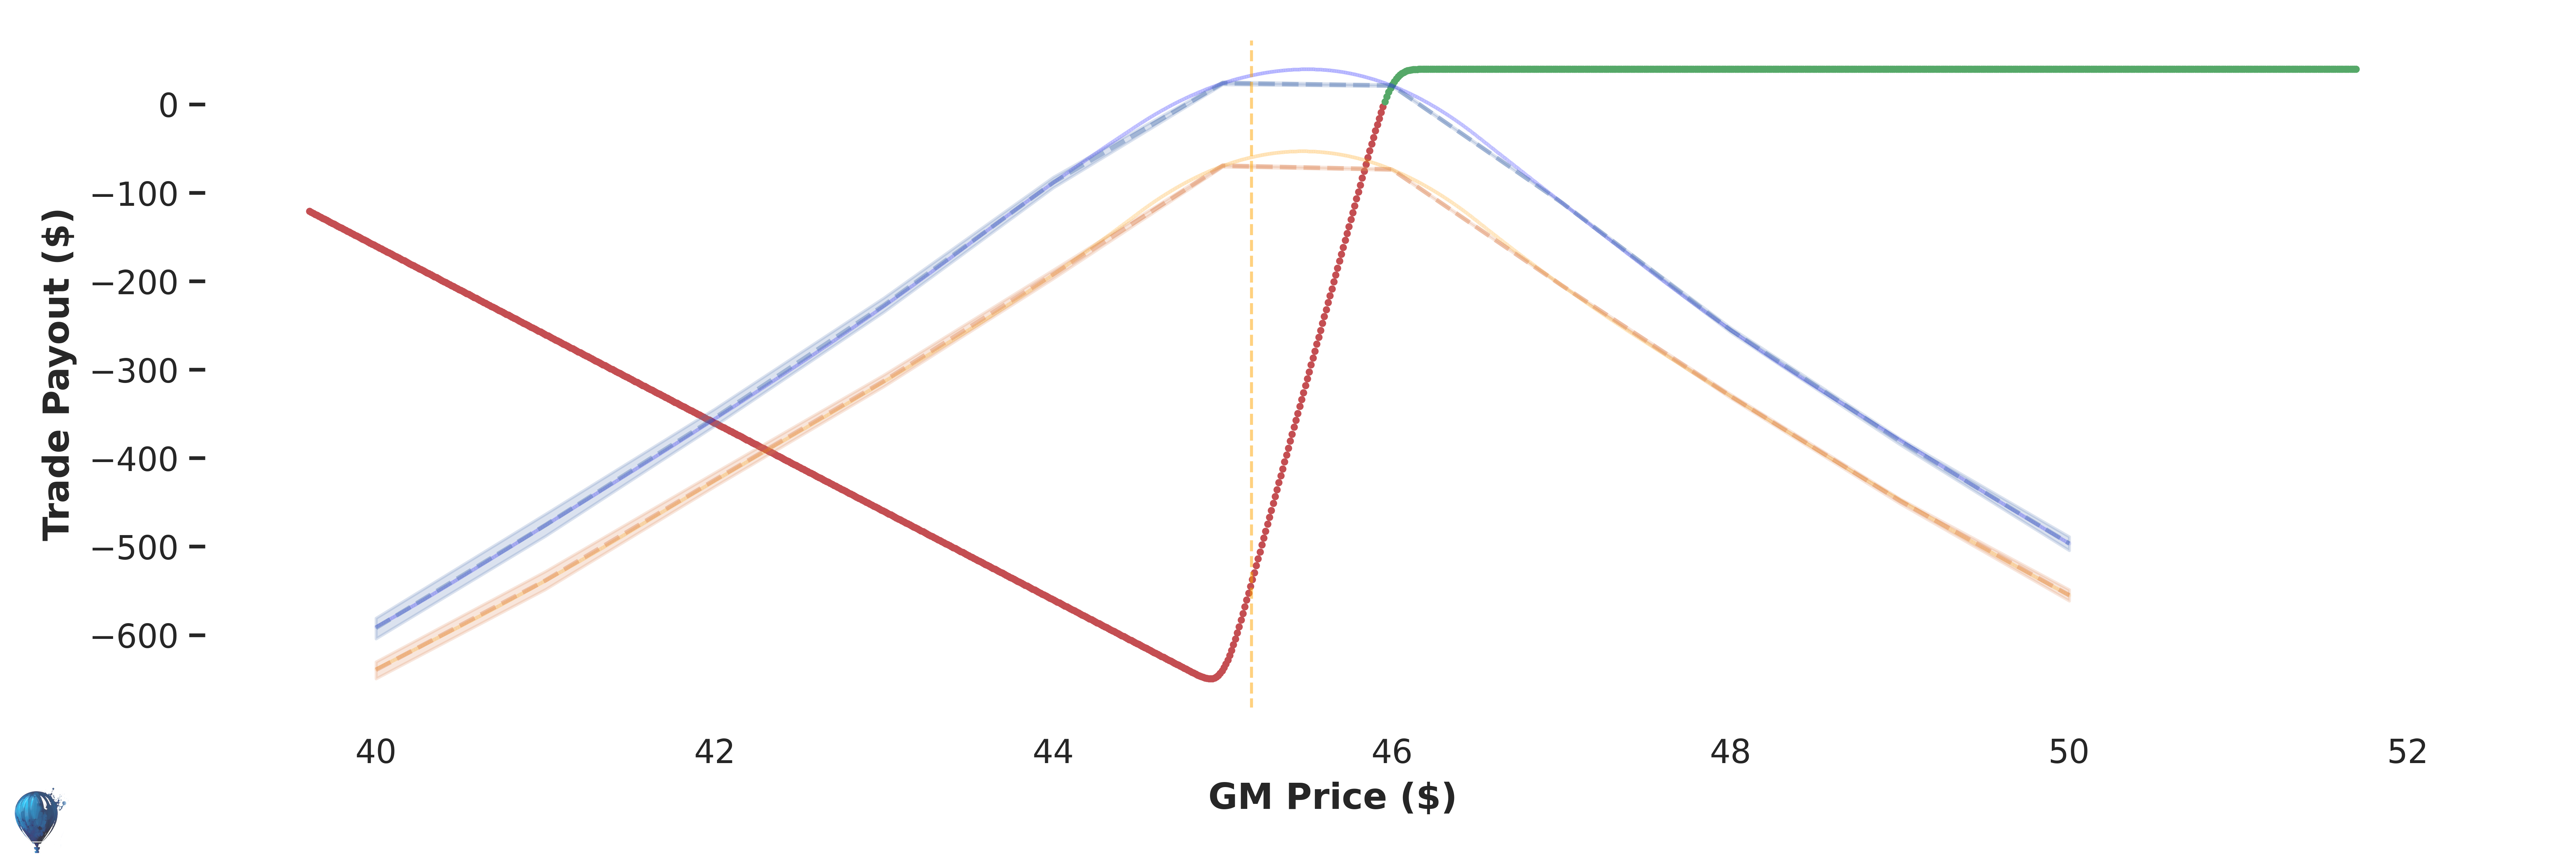
📉 Bearish
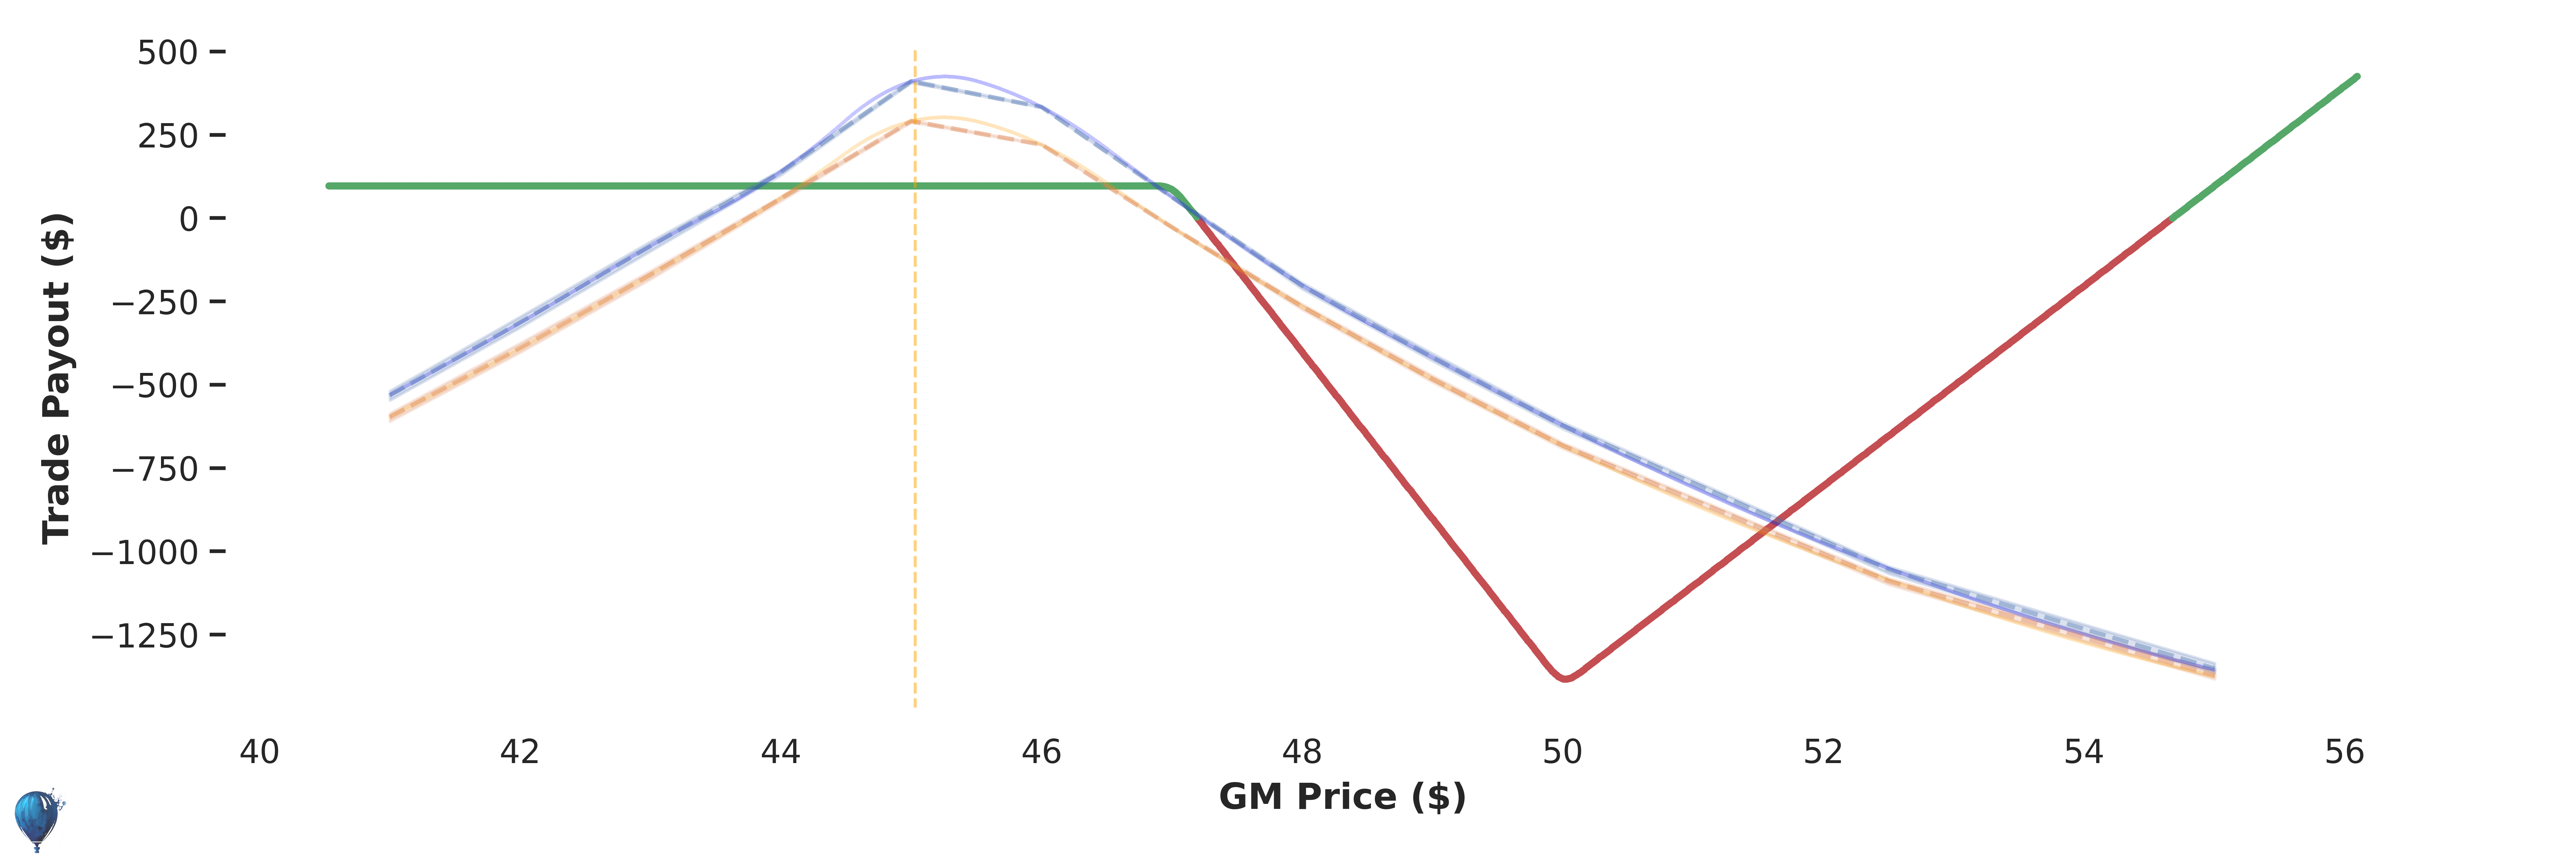
📈 Bullish
Credit:
$143
Max Loss:
$1106
Annual Return:
62%
Odds of Profit
(?)
62%
Trade Edge
(?)
+ $28
Historical Performance: 10 Trades
-24% Annual
Trade Payout in 16 Days
Green line
Red line
Blue line
Orange line
Access Full GM Strategy + 1-Click Execution
Unlock Full Strategy
Credit:
$331
Max Loss:
$1068
Annual Return:
77%
Odds of Profit
(?)
74%
Trade Edge
(?)
+ $28
Historical Performance: 10 Trades
+ 20% Annual
Trade Payout in 58 Days
Green line
Red line
Blue line
Orange line
Access Full GM Strategy + 1-Click Execution
Unlock Full Strategy