Max Loss: $23 Max Win: $77
Risk
Historical Performance (20 Trades)
Trade Payout in 8 Days
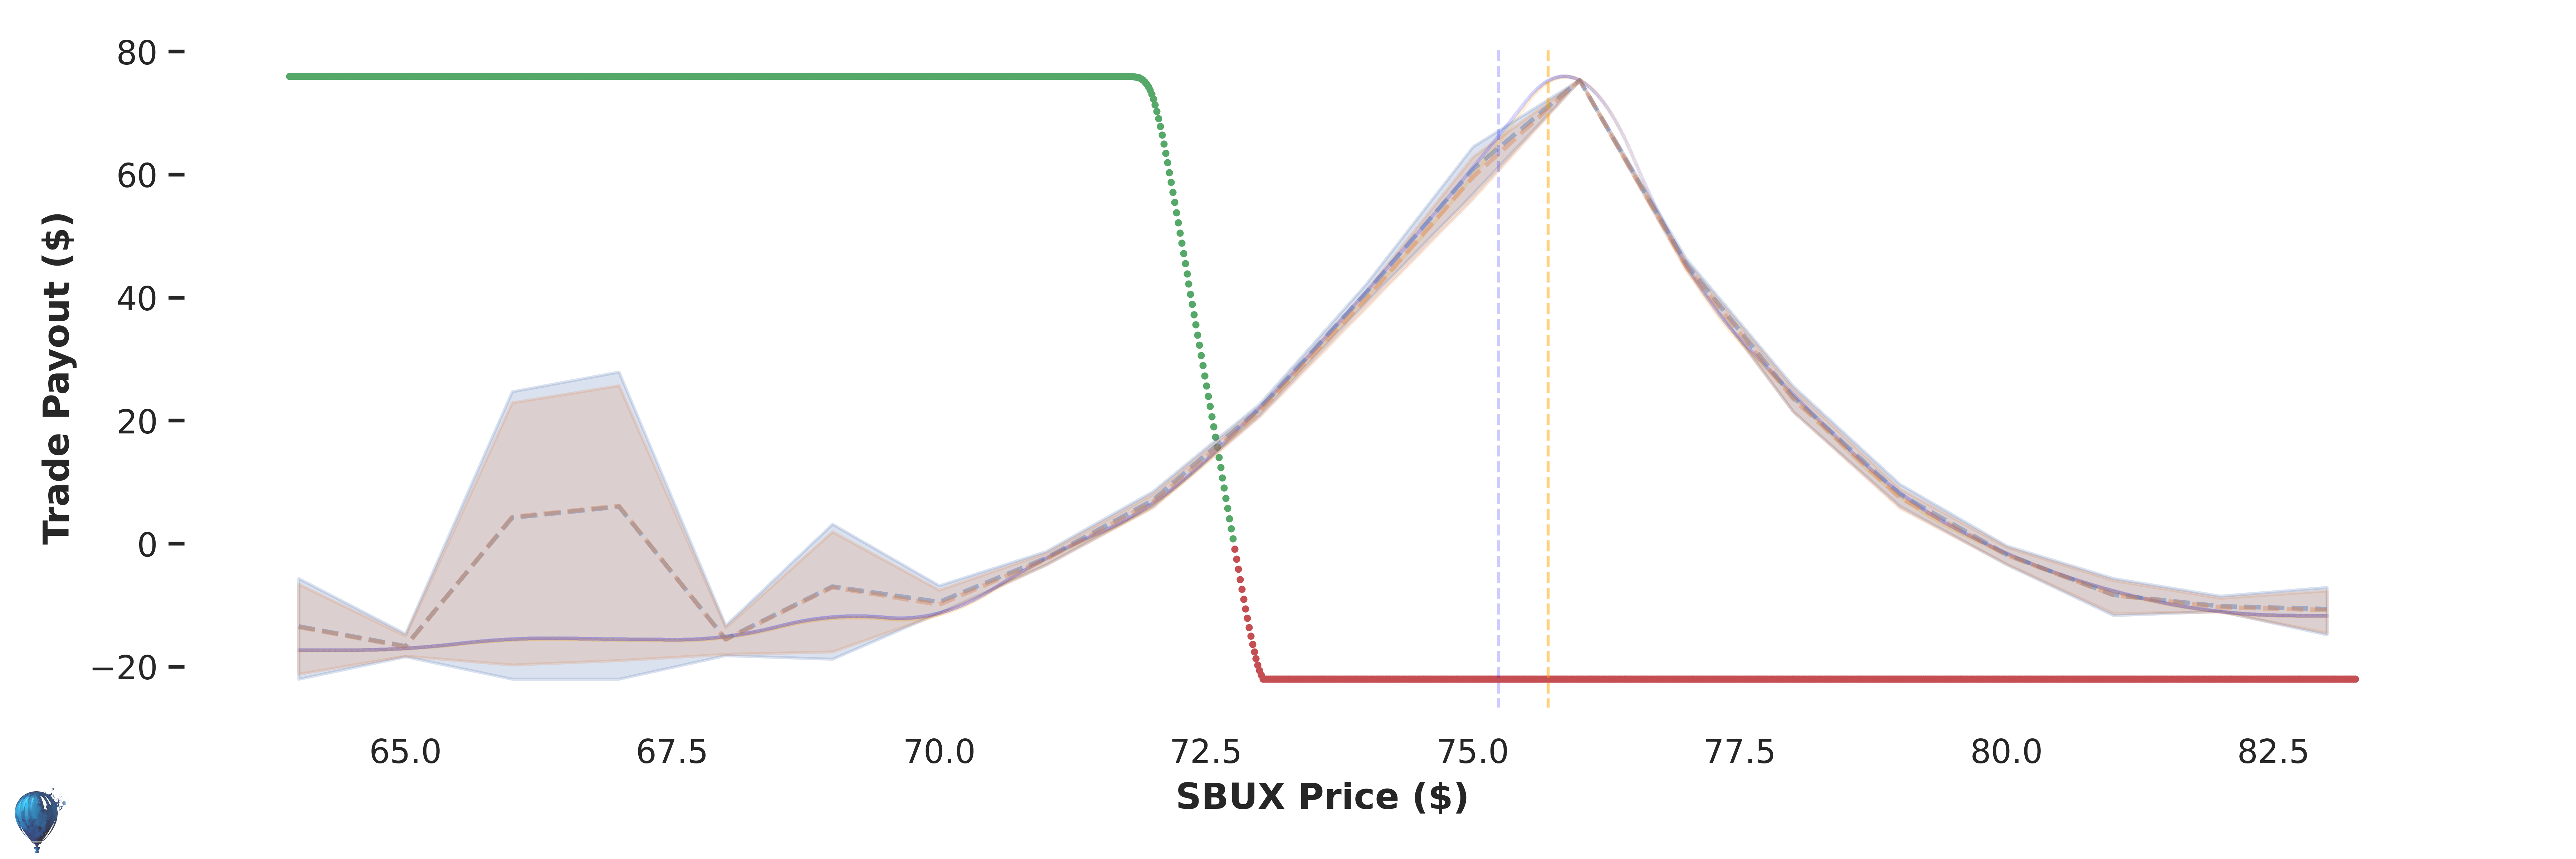
Green line
Red line Blue line
Orange line
Access Full SBUX Strategy + 1-Click Execution
Max Loss: $21 Max Win: $79
Risk
Historical Performance (24 Trades)
Trade Payout in 22 Days
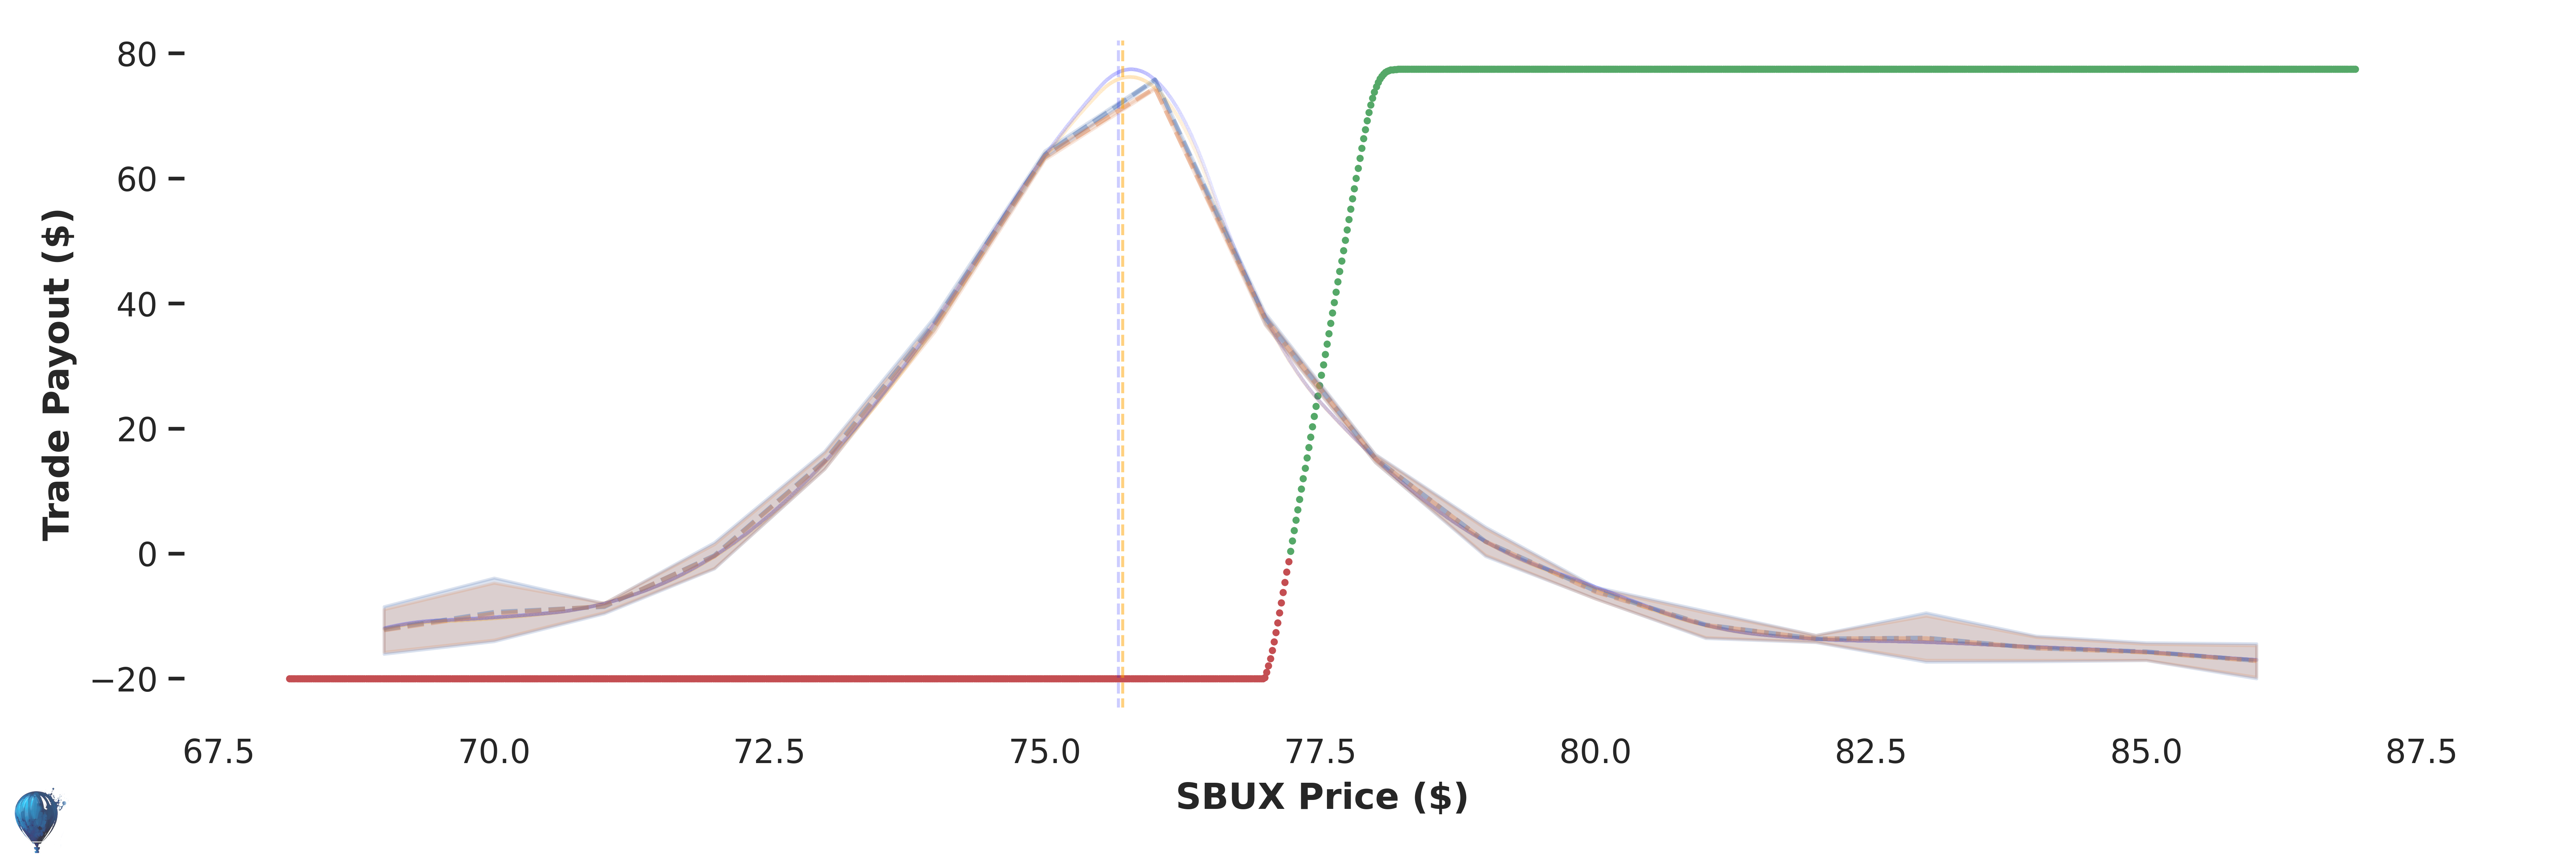
Green line
Red line Blue line
Orange line
Access Full SBUX Strategy + 1-Click Execution