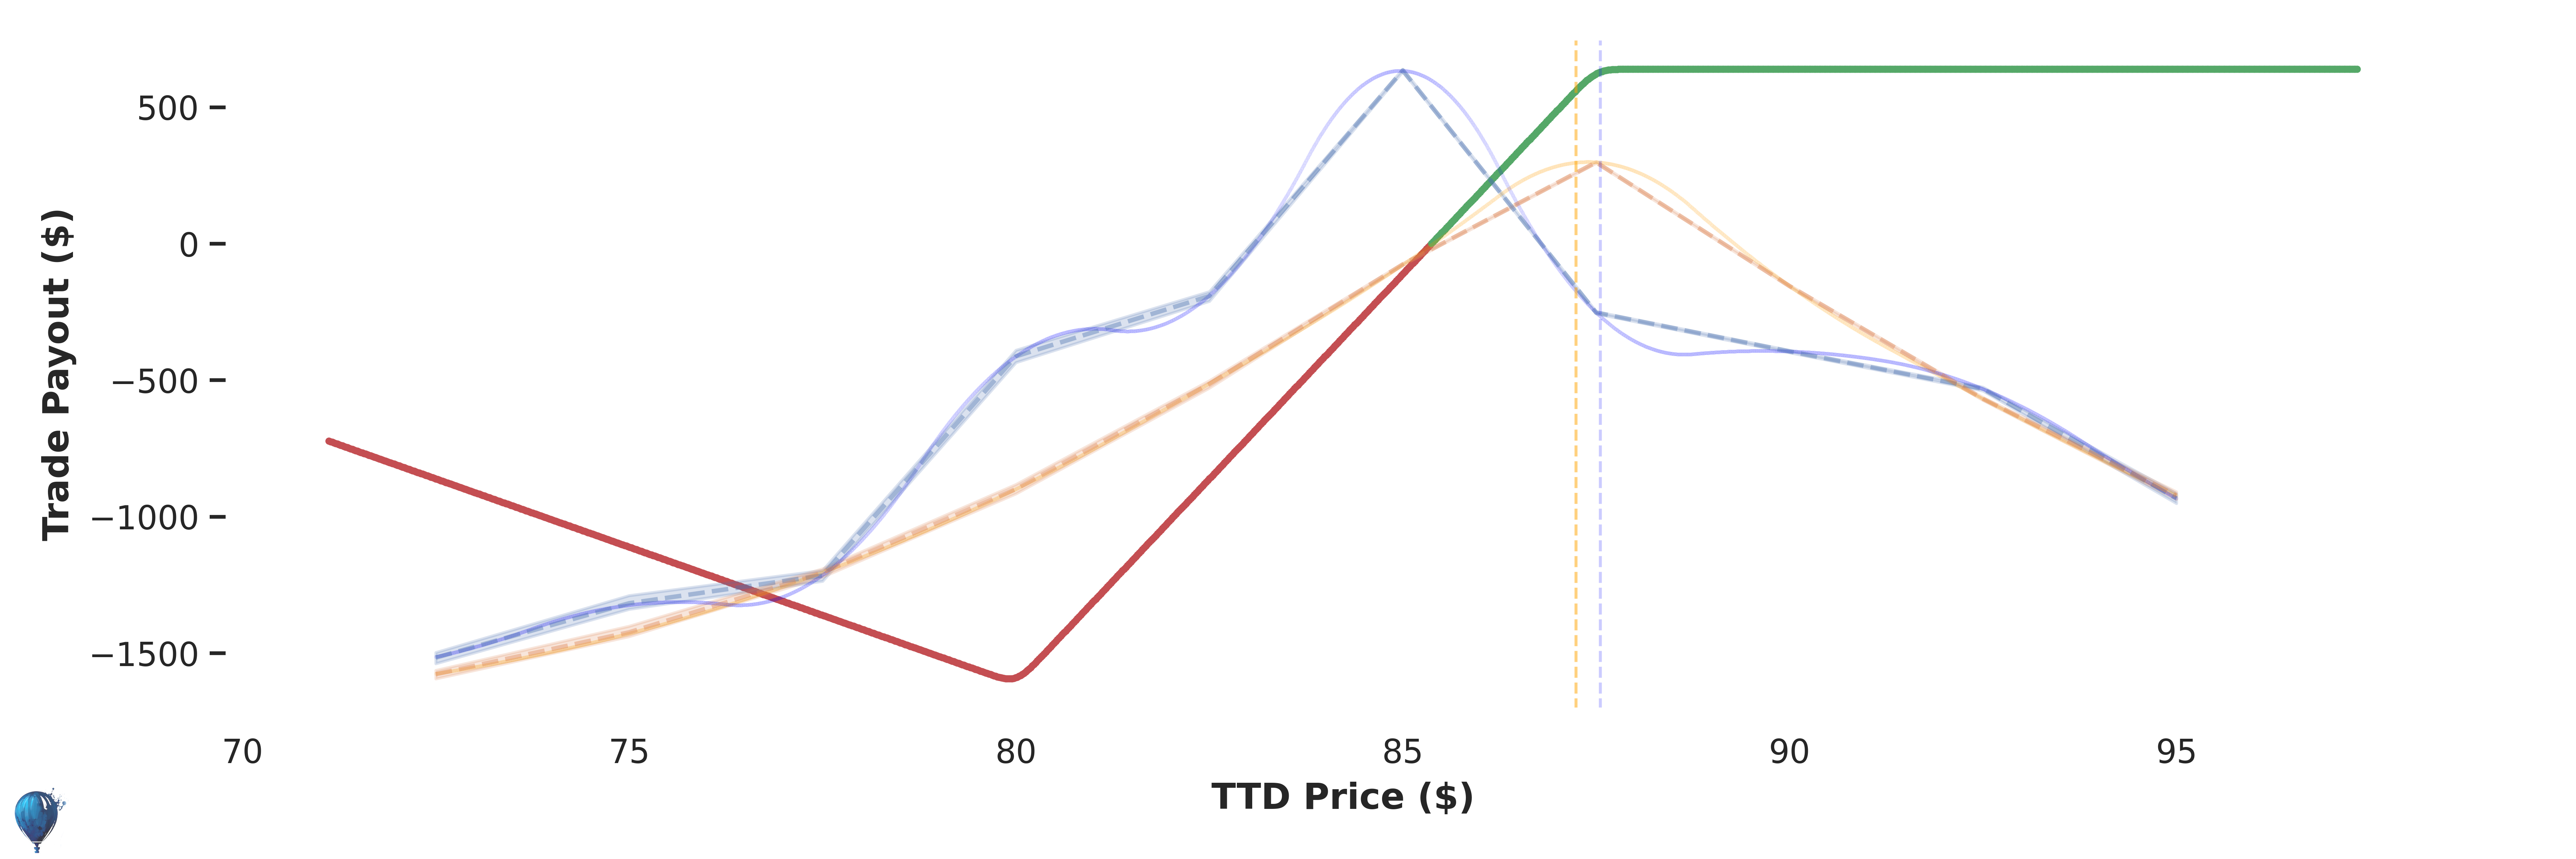
📉 Bearish
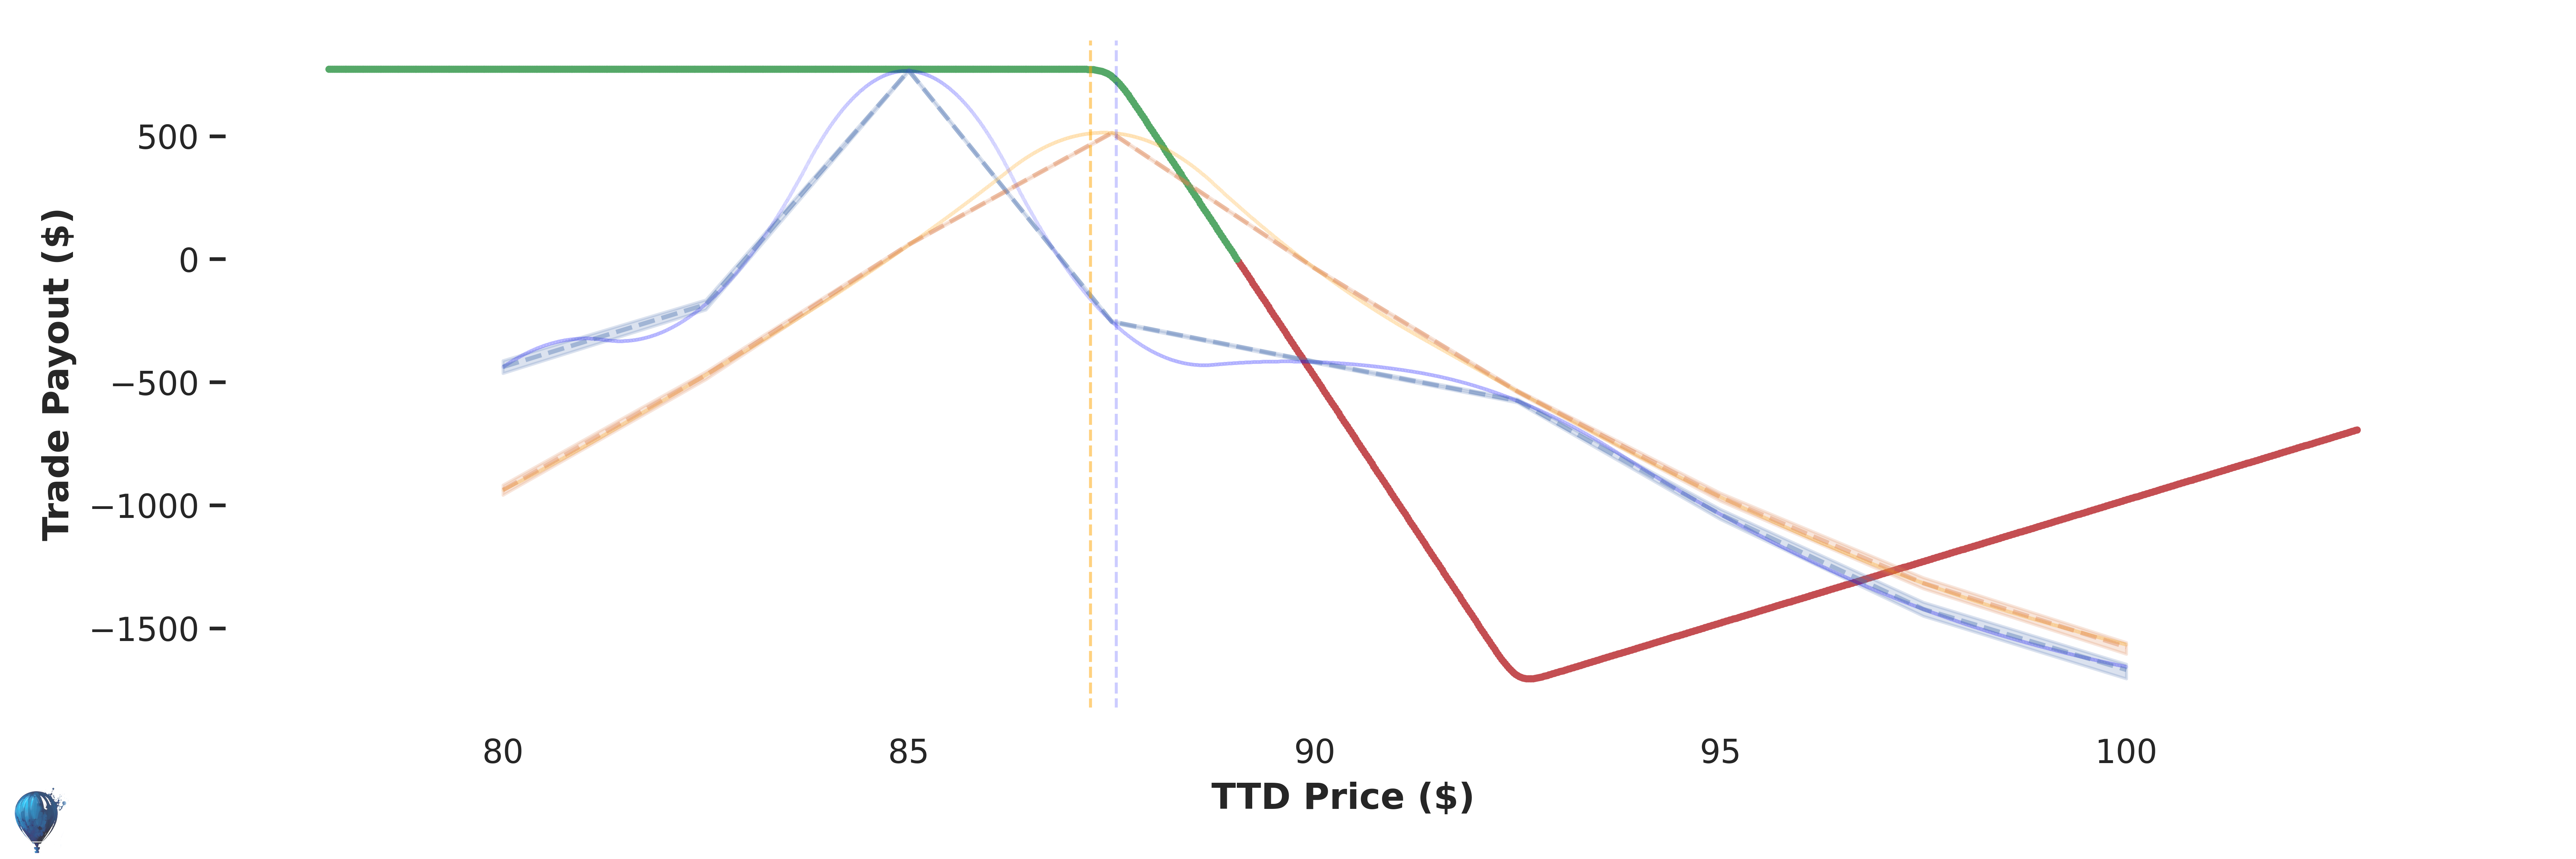
📈 Bullish
Max Win:
$18
Max Loss:
$82
Annual Return:
155%
Odds of Profit
(?)
63%
Trade Edge
(?)
$-11
Historical Performance: 12 Trades
-21% Annual
Trade Payout in 8 Days
Green line
Red line
Blue line
Orange line
Access Full TTD Strategy + 1-Click Execution
Unlock Full Strategy
Max Win:
$23
Max Loss:
$76
Annual Return:
216%
Odds of Profit
(?)
64%
Trade Edge
(?)
$-13
Historical Performance: 12 Trades
+ 24% Annual
Trade Payout in 8 Days
Green line
Red line
Blue line
Orange line
Access Full TTD Strategy + 1-Click Execution
Unlock Full Strategy