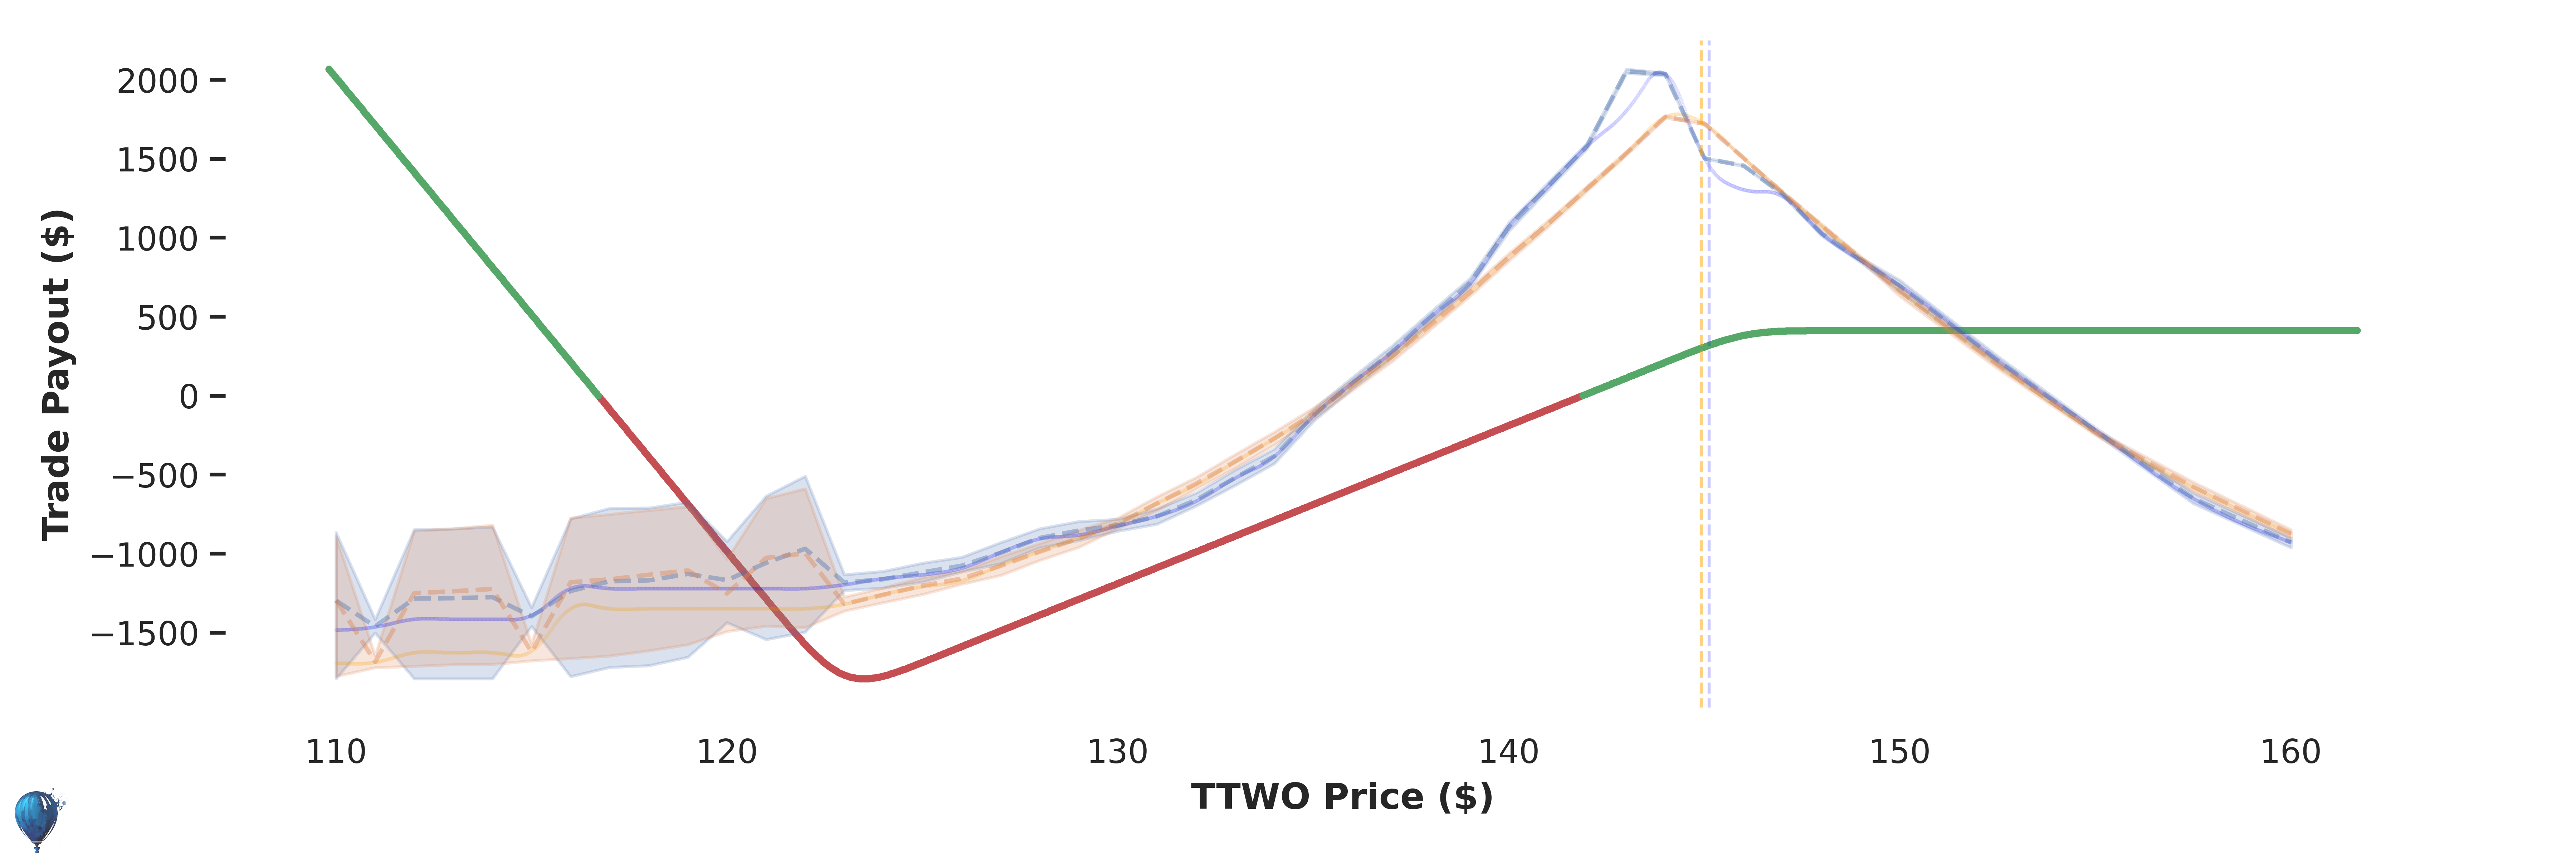
📉 Bearish
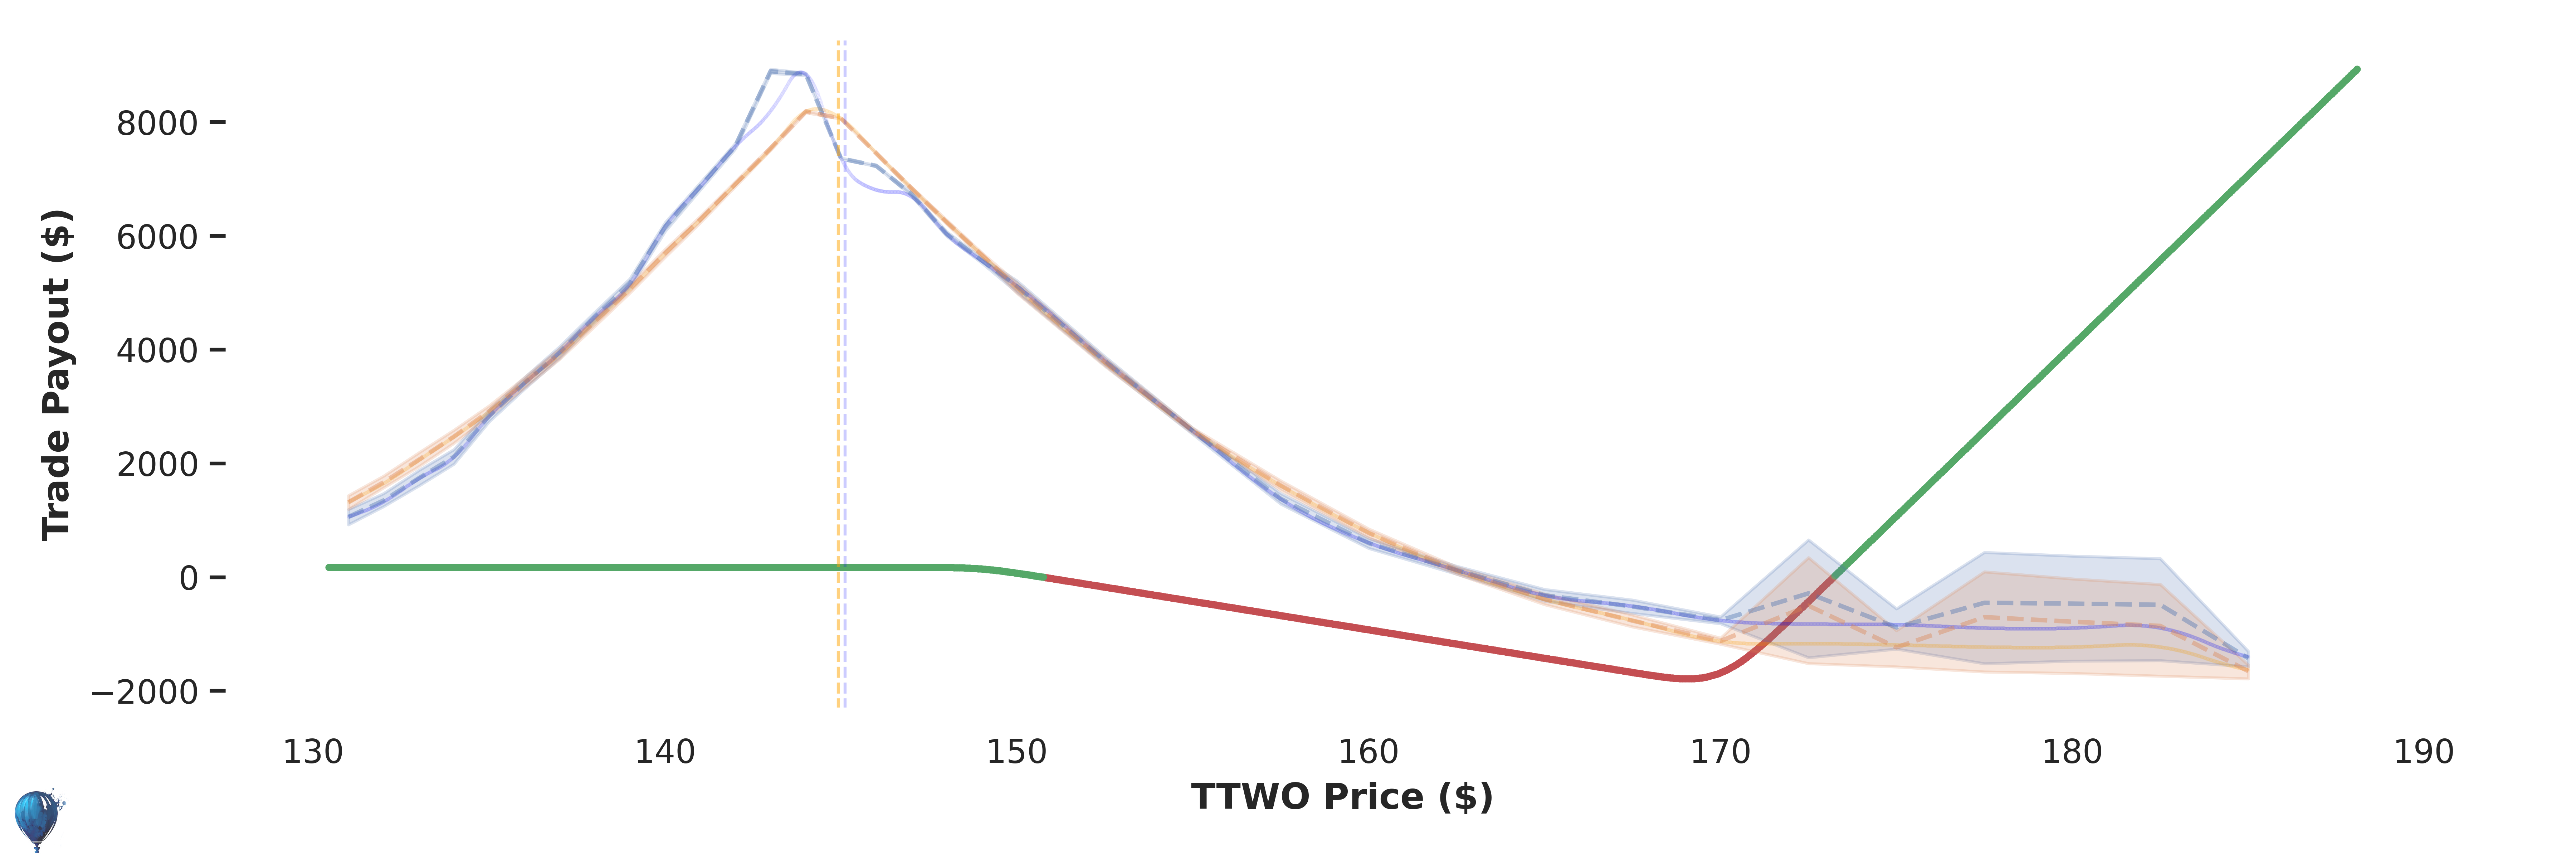
📈 Bullish
Credit:
$119
Max Loss:
$981
Annual Return:
76%
Odds of Profit
(?)
78%
Trade Edge
(?)
+ $53
Historical Performance: 15 Trades
-3% Annual
Trade Payout in 9 Days
Green line
Red line
Blue line
Orange line
Access Full TTWO Strategy + 1-Click Execution
Unlock Full Strategy
Credit:
$109
Max Loss:
$840
Annual Return:
82%
Odds of Profit
(?)
80%
Trade Edge
(?)
+ $57
Historical Performance: 15 Trades
+ 12% Annual
Trade Payout in 9 Days
Green line
Red line
Blue line
Orange line
Access Full TTWO Strategy + 1-Click Execution
Unlock Full Strategy