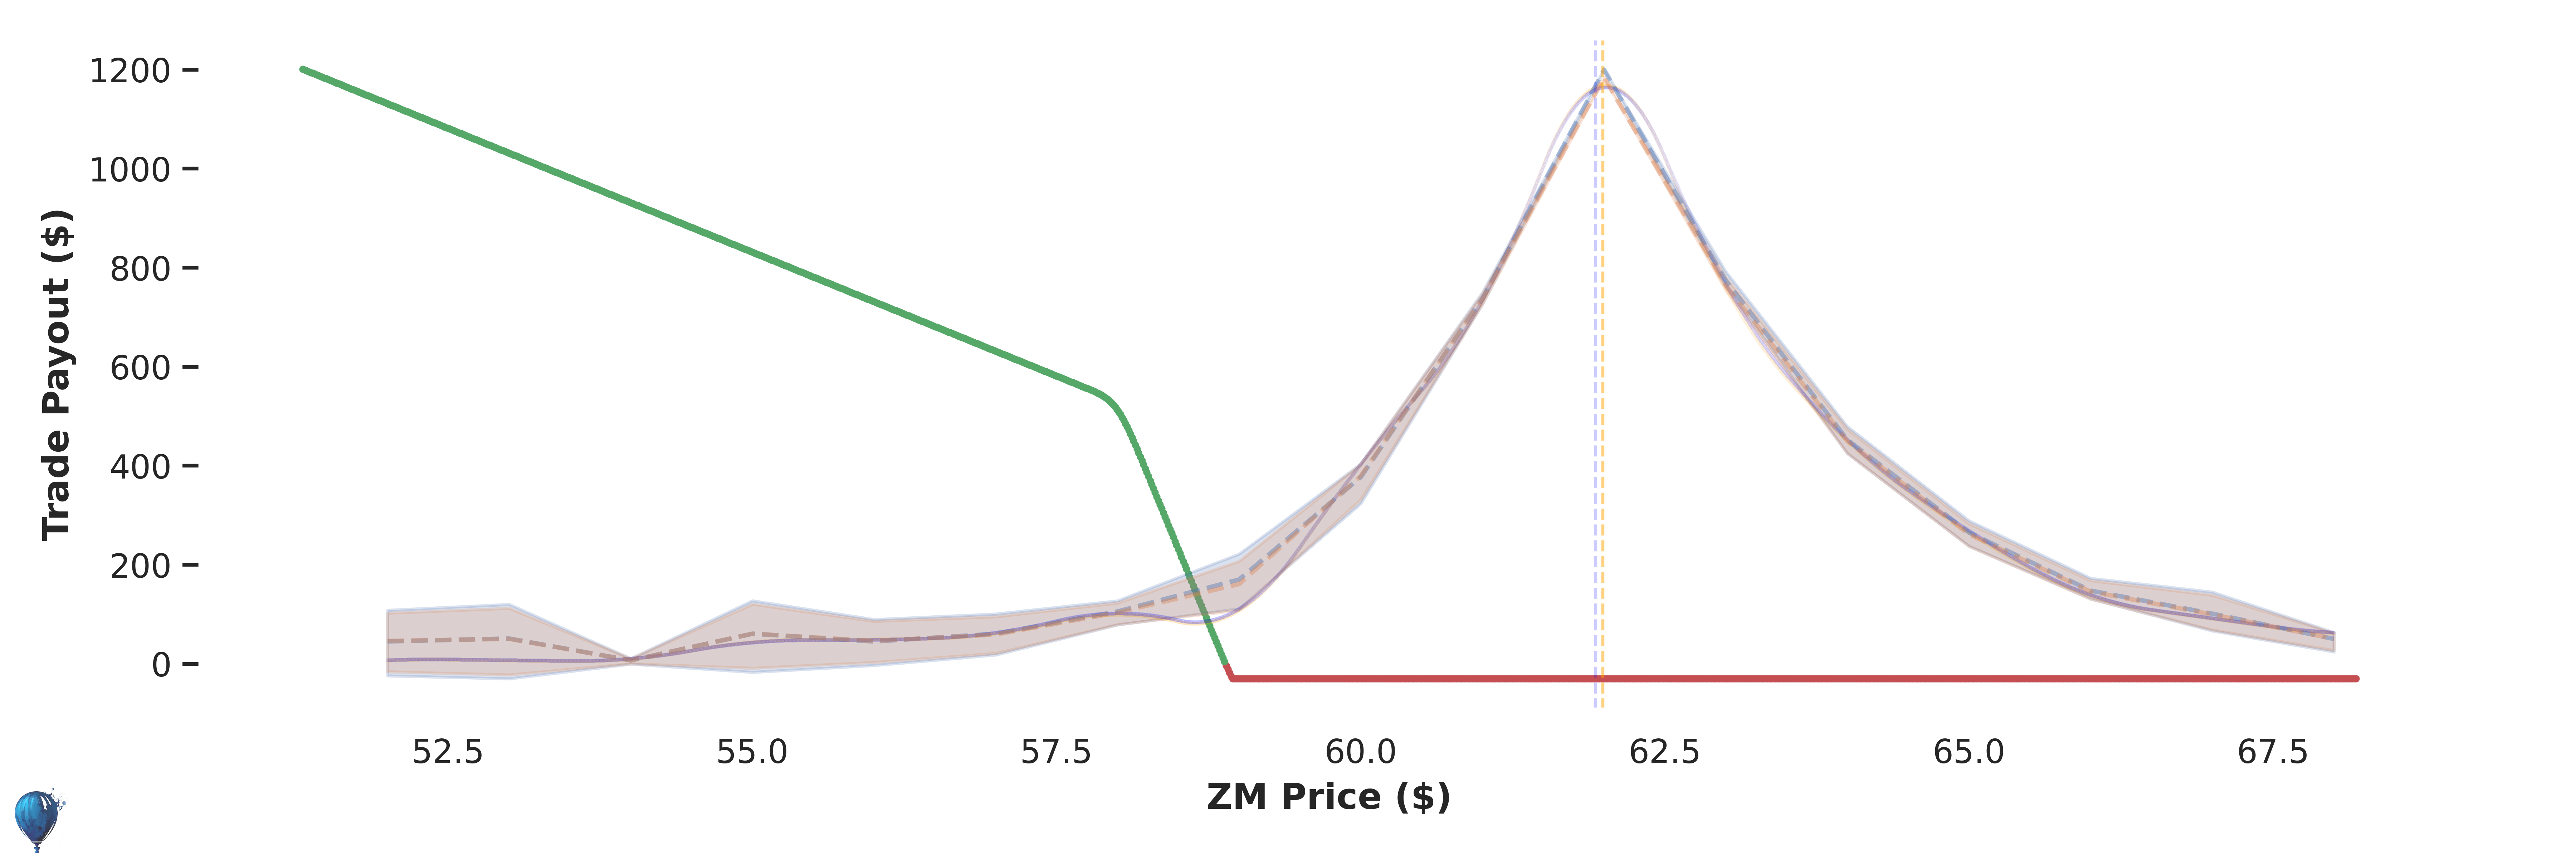
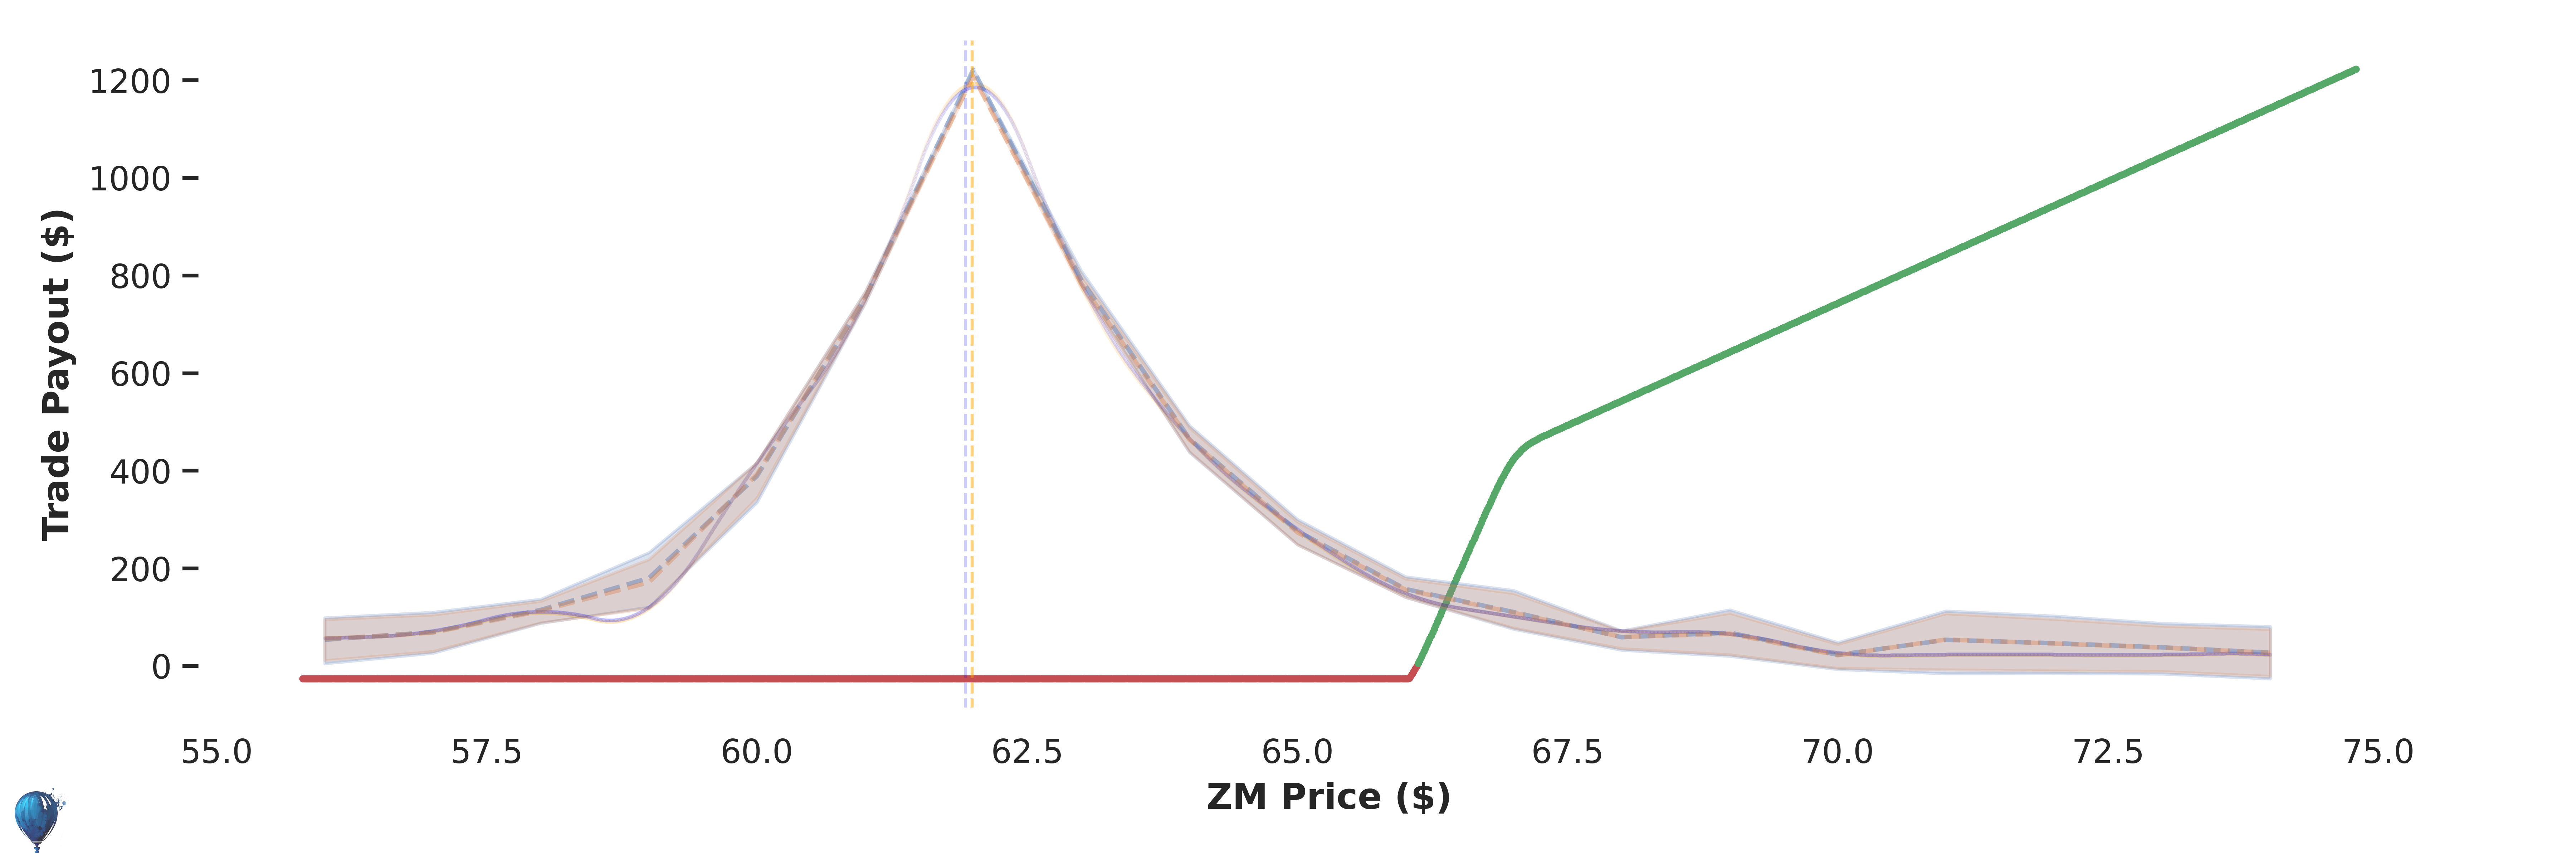
📈 Bullish
📉 Bearish
Max Loss:
$17
Max Win:
$82
Risk
1
to make 5.0
Odds of Profit
(?)
25%
Trade Edge
(?)
$-25
Historical Performance (59 Trades)
+ 0% Annual
Daily Optimized
Bearish
Trade Payout in 7 Days
Potential Profit
Potential Loss
Price Distribution
Show Trade Details
Buy 1
ZM 05/16/2025 79.00 P
@ $0.45
Market Probability In The Money: 24%
Sell 1
ZM 05/16/2025 78.00 P
@ $0.29
Market Probability In The Money: 17%
⚖️ Trade Balancer
Trade Balancer
Underlying Correlation: -0.81
Video Tutorial
Options Pricing
Historical Performance
Risk Profiles
Current Options Pricing
X Axis:
Price of ZM
Dashed blue line:
Helium estimated price
Dashed orange line:
Market last price
Vertical orange line:
ZM last closing price
Historical Performance
Total Return:
0% (0% Annual)
Average P/L:
$-0.44
# Trades:
59
Success:
23%
X Axis:
Time
Y Axis:
Cumulative % return
Vertical lines:
Days with new trades added
Download Trade Log
Sensitivity to Volatility
X Axis:
% price change of implied volatility (uncertainty)
Y Axis:
potential
profit
or
loss
due to current changes in implied volatility
Trade Time Decay
X Axis:
days projected into the future
Y Axis:
potential
profit
or
loss
due to time
Greeks
Delta
(?)
:
$-7.3
Beta
(?)
:
$-8.0
Theta
(?)
:
$-1.2
Gamma
(?)
:
$2.2
Vega
(?)
:
$0.7
Optimized
May 09, 2025
.
Share Link:
?
Max Loss:
$16
Max Win:
$33
Risk
1
to make 2.1
Odds of Profit
(?)
28%
Trade Edge
(?)
$-9
Historical Performance (59 Trades)
+ 44% Annual
Daily Optimized
Bullish
Trade Payout in 7 Days
Potential Profit
Potential Loss
Price Distribution
Show Trade Details
Buy 1
ZM 05/16/2025 82.50 C
@ $0.79
Market Probability In The Money: 35%
Sell 1
ZM 05/16/2025 83.00 C
@ $0.63
Market Probability In The Money: 30%
⚖️ Trade Balancer
Trade Balancer
Underlying Correlation: -0.81
Video Tutorial
Cheap Hedge
Underlying Correlation: 0.88
Video Tutorial
Options Pricing
Historical Performance
Risk Profiles
Current Options Pricing
X Axis:
Price of ZM
Dashed blue line:
Helium estimated price
Dashed orange line:
Market last price
Vertical orange line:
ZM last closing price
Historical Performance
Total Return:
40% (44% Annual)
Average P/L:
$29.41
# Trades:
59
Success:
30%
X Axis:
Time
Y Axis:
Cumulative % return
Vertical lines:
Days with new trades added
Download Trade Log
Sensitivity to Volatility
X Axis:
% price change of implied volatility (uncertainty)
Y Axis:
potential
profit
or
loss
due to current changes in implied volatility
Trade Time Decay
X Axis:
days projected into the future
Y Axis:
potential
profit
or
loss
due to time
Greeks
Delta
(?)
:
$5.5
Beta
(?)
:
$6.0
Theta
(?)
:
$-0.5
Gamma
(?)
:
$0.8
Vega
(?)
:
$0.3
Optimized
May 09, 2025
.
Share Link:
?